Sunday 23 May 2010
Average UK Earnings – May 2010 Update
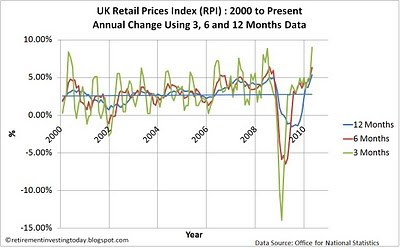
As we know inflation according to the retail prices index (RPI) year on year is currently running at 5.3%. This is the highest it has been since July 1991. Looking at historic RPI inflation data shows the average year on year RPI annual change since 1991 at 2.9% and the trendline since 1991 shows inflation year on year trending downwards. My chart today shows these RPI figures in blue.
Saturday 22 May 2010
Australian (ASX 200) stock market including the cyclically adjusted price earnings ratio (PE10 or CAPE) – May 2010 Update
To try and squeeze some more performance out of a retirement investing strategy that is heavily focused on asset allocation I am using a cyclically adjusted PE ratio (known as the PE10 or CAPE) for the ASX 200 to attempt to value the Australian Stock Market. The method used is based on that developed by Yale Professor Robert Shiller for the S&P 500. I will call it the ASX 200 PE10 and it is the ratio of Real (ie after inflation) Monthly Prices and the 10 Year Real (ie after inflation) Average Earnings. For my Australian Equities I will use a nominal ASX 200 PE10 value of 16 to equate to when I hold 21% Australian Equities. On a linear scale I will target 30% less stocks when the ASX 200 PE10 = 26 and will own 30% more stocks when the ASX 200 PE10 = 6.
Thursday 20 May 2010
US Consumer Price Index (CPI) Inflation – April 2010 Update
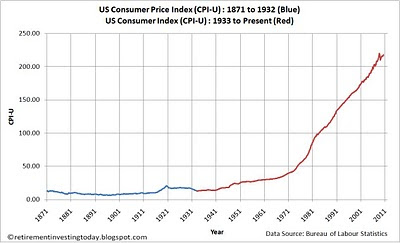
The above chart shows the US Consumer Price Index (CPI-U) to April 2010 courtesy of the US Bureau of Labor Statistics. Year on year the US CPI inflation index has risen from 213.24 to 218.009 which equates to 2.2% today (down from 2.3% last month). Annualising the last 6 months has inflation at 1.7% and annualising the last 3 months has inflation running at 2.4%.
Wednesday 19 May 2010
UK Inflation – May 2010 Update
The Office for National Statistics has reported the April 2010 UK Consumer Price Index (CPI) as 3.7% up from 3.4% and the UK Retail Price Index (RPI) as 5.3% which is up from 4.4% last month. Regular readers of Retirement Investing Today will I’m sure not be surprised by this at all as the Bank of England have clearly positioned themselves to let inflation run.
Tuesday 18 May 2010
A History of Severe Real S&P 500 Stock Bear Markets – May 2010 Update
Looking at the first chart which shows the real (inflation adjusted) S&P 500 (or its predecessor) stock market I have identified three historic severe stock bear markets. These I am defining as stock markets where from the stock market reaching a new high, they then proceeded to lose in excess of 60% of their real (inflation adjusted) value. These are best demonstrated by the second chart which shows each of these stock bear markets and the fall in percentage terms from the peak. So briefly what were these bear markets (full details here).
Subscribe to:
Posts (Atom)


