Showing posts with label CAPE. Show all posts

Tuesday 10 May 2011

The FTSE 100 cyclically adjusted PE ratio (FTSE 100 CAPE or PE10) – May 2011

Now that I’m back in the blogging world I’ve been catching up on all the great posts that I’ve missed over the past few months from My Blog List (full list in the right hand sidebar of the page).  Great UK based blogs such as Monevator, A Grain of Salt, Simple Living in Suffolk and UK Value InvestorThis post from ermine at Simple Living has however made me think about my cyclically adjusted PE (PE10 or CAPE) strategy and whether it is the right thing to be doing.  I am a big believer in the Keep It Simple Stupid (KISS) principle and if somebody like ermine can’t understand what I’m up to then have I made it all too complicated?

Sunday 19 December 2010

The ASX 200 cyclically adjusted PE ratio (ASX 200 CAPE or ASX200 PE10) – December 2010 Update

The Australian ASX200 is currently 4763. Let’s look at the usual monthly indicators that I monitor every month for this index. My first chart shows the cyclically adjusted PE ratio (ASX200 PE10 or CAPE) at 17.8 which is up from 17.2 last month. The P/E ratio on the other hand heads in the opposite direction, heading downwards from 18.6 to 16.4.

Sunday 12 December 2010

The FTSE 100 cyclically adjusted PE ratio (CAPE or PE10) – December 2010

Today’s first chart shows that with the nominal FTSE 100 price moving from 5694.6 (01 November) to 5642.5 (01 December) over the month, a decrease of 0.9%, the cyclically adjusted PE ratio (PE10 or CAPE) has also fallen from 14.1 to 13.9. These calculations are based on using the Consumer Price Index (CPI) to correct for inflationary effects. If I was to use the Retail Prices Index the PE10 would be 13.6. This is still well below the FTSE 100 PE10 20 Percentile for this dataset of 16.8 while the 80 Percentile is 23.7. The long run average is 19.9 for the dataset shown in the chart. The correlation between the PE10 and the Real (inflation adjusted by the CPI) FTSE Price remains a strong 0.69. In comparison the standard PE ratio is sitting at 11.6, down from 14.5 last month.

Thursday 25 November 2010

It must be nearly bonus time and the S&P 500 cyclically adjusted PE (PE10 or CAPE) – November 2010 Update

If you’re a bank, particularly a bailed out tax payer owned bank, who’s about to pay out £7 billion or so in bonuses (which is the equivalent of £113 for every man, woman and child in the UK), while everyone else in the country is going through austerity and slowly being made redundant, then you have a seriously hard sell on your hands if you don’t want to be lynched. Before announcing the bonuses you need to get your PR machine into gear and show the general public that you’re not immoral or greedy but instead a warm and loveable organisation who cares about the general public and wants to help society as a whole.

Sunday 3 October 2010

No nonsense FTSE 100 cyclically adjusted PE ratio update – October 2010

No ramblings from me today. It’s just a simple update of the FTSE 100 cyclically adjusted PE (CAPE or PE10).

The first chart shows that with the nominal FTSE 100 price moving from 5371 to 5592.9, an increase of 4.1%, over the month the PE10 ratio has also risen from 13.5 to 14.1. This is still well below the FTSE 100 PE10 20 Percentile of 17.0 while the 80 Percentile is 23.7. The long run average is now 19.9 for the dataset shown in the chart. The correlation between the PE10 and the Real (inflation adjusted by the CPI) FTSE Price is a strong 0.70.

Sunday 19 September 2010

The PE10 nears its 80 Percentile - S&P 500 cyclically adjusted PE (PE10 or CAPE) – September 2010 Update

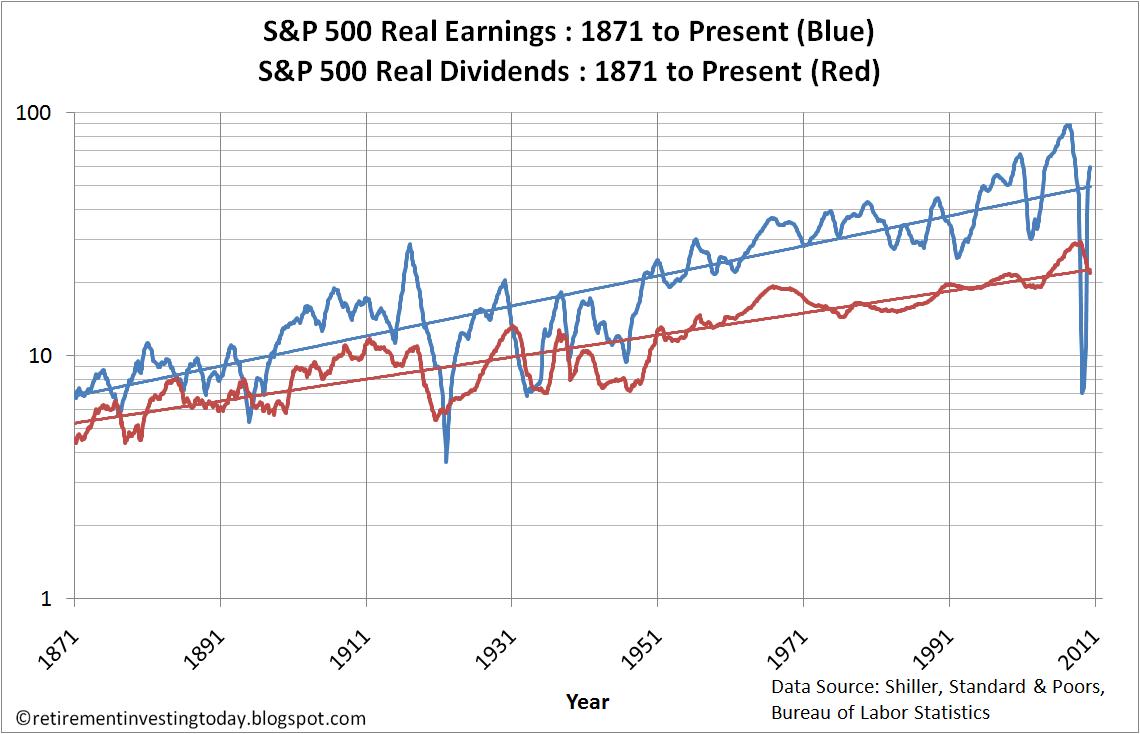
Standard and Poors is showing, with 99% of earnings data available, that the Q2 2010 earnings per share for the S&P 500 will be $19.68. That’s a long way from the -$23.25 we saw in Q4 2008. This then has Standard and Poors all excited as they are now estimating that earnings for Q2 2011 will be $21.43 which is a year on year increase of 9%. So no predictions of a double dip recession there.

Why in this world do people always continually assume that because you have earnings of x this time that next time earnings will be x + 10% or so? My company does the same. You have a great year this year so the expectation is that next year you will have a great year plus another 10%. They do the same thing with turnover targets. To me this just seems nigh on impossible as eventually you end up so far up the exponential growth curve with it compounding year on year that you are almost destined for failure. Also where is this additional growth coming from? The world is not growing at 10% so the assumption must be that you are taking market share from someone else. But with the S&P 500 you have on average 500 companies all growing earnings by 9%. That doesn’t seem sustainable. I guess a good example of this is Nokia and the rise in competition from Apple and also the Android Operating System phones. I wonder if Nokia’s board was up until a couple of years ago forecasting this never ending exponential growth also? Now the flavour of the month is Apple but for how long?

Wednesday 11 August 2010

Interest rates at 0% haven’t worked, QE hasn’t worked, will QE Lite - S&P 500 cyclically adjusted PE (PE10 or CAPE) – August 2010 Update

In an attempt to try and force a recovery in the US the Federal Reserve have decided that they will undertake “QE Lite” which will entail using the proceeds from maturing mortgage bonds, which were bought using Quantitative Easing (money printing in my books), to now buy long dated government debt. I guess they are hoping that this will force bond yields down further which will reduce borrowing costs across the board for the average punter. I’m thinking two things:

Saturday 7 August 2010

The market is climbing from its June low - Australian (ASX 200) stock market plus its PE10 – August 2010 Update

The Australian stock market index, the ASX200, closed on Friday at 4566. This means that since the June average low of 4302 the market has risen by 6% in a little over one month. As of Fridays close the cyclically adjusted PE ratio (ASX200 PE10 or CAPE) has risen from 16.51 in June to 17.36. This can all be clearly seen in my first chart today.

Wednesday 4 August 2010

My first FTSE 100 cyclically adjusted PE ratio update – August 2010

As regular readers will know I monthly follow the cyclically adjusted PE ratios, also known as a CAPE or PE10, for both the US S&P 500 and the Australian ASX 200. Based on this information I make tactical asset allocations to my equity funds with the only exception being my allocation to emerging markets. Today though is quite exciting because it’s the first update of a brand new dataset which I first introduced here. That dataset is the FTSE 100 CAPE or FTSE 100 PE10 and it is the ratio of the Real (inflation adjusted) Price divided by the average Real Earnings of the last 10 years for the FTSE 100.

Sunday 11 July 2010

UK FTSE 100 CAPE or FTSE PE10 based on the Shiller cyclically adjusted price earnings ratio model

Update 13 July 2010: Chart 3 added following UKVI's comment below.

For many months now I have been showing the PE10 for the ASX200 and the S&P500 however what I have always been looking for is a cyclically adjusted PE ratio dataset for the UK FTSE100. In shorthand a FTSE100 CAPE or FTSE100 PE10 depending on your preference for acronyms. Unfortunately a complete dataset has been impossible to find. I have therefore spent many hours constructing one from pieces of data taken from Motley Fool Discussion Boards, the Financial Times marketdata and Yahoo Finance. I therefore can for the first time present a chart of the FTSE100 PE10 and for good measure I’ll throw in the Real (inflation adjusted) FTSE100.

Monday 5 July 2010

US (S&P 500) stock market including the cyclically adjusted price earnings ratio (PE10 or CAPE) – June 2010 Update

To try and squeeze some more performance out of a retirement investing strategy that is heavily focused on buy & hold and asset allocation I am using a Cyclically Adjusted Price / Average 10 Year Earnings (PE10 or CAPE) ratio for the S&P 500 to value the US (specifically the S&P 500) stock market. The method used is that developed by Yale Professor Robert Shiller however I also incorporate earnings estimates up to the PE10 month of interest. Background information here.

Saturday 3 July 2010

Australian (ASX 200) stock market including the cyclically adjusted price earnings ratio (PE10 or CAPE) – June 2010 Update

To try continue to try and squeeze some more performance out of a retirement investing strategy that is heavily focused on asset allocation I am using a cyclically adjusted PE ratio (known as the PE10 or CAPE) for the ASX 200 to attempt to value the Australian Stock Market. The method used is based on that developed by Yale Professor Robert Shiller for the S&P 500. I will call it the ASX 200 PE10 and it is the ratio of Real (ie after inflation) Monthly Prices and the 10 Year Real (ie after inflation) Average Earnings. For my Australian Equities I will use a nominal ASX 200 PE10 value of 16 to equate to when I hold 21% Australian Equities. On a linear scale I will target 30% less stocks when the ASX 200 PE10 = 26 and will own 30% more stocks when the ASX 200 PE10 = 6.

Saturday 22 May 2010

Australian (ASX 200) stock market including the cyclically adjusted price earnings ratio (PE10 or CAPE) – May 2010 Update

To try and squeeze some more performance out of a retirement investing strategy that is heavily focused on asset allocation I am using a cyclically adjusted PE ratio (known as the PE10 or CAPE) for the ASX 200 to attempt to value the Australian Stock Market. The method used is based on that developed by Yale Professor Robert Shiller for the S&P 500. I will call it the ASX 200 PE10 and it is the ratio of Real (ie after inflation) Monthly Prices and the 10 Year Real (ie after inflation) Average Earnings. For my Australian Equities I will use a nominal ASX 200 PE10 value of 16 to equate to when I hold 21% Australian Equities. On a linear scale I will target 30% less stocks when the ASX 200 PE10 = 26 and will own 30% more stocks when the ASX 200 PE10 = 6.

Monday 17 May 2010

US (S&P 500) stock market including the cyclically adjusted price earnings ratio (PE10 or CAPE) – May 2010 Update

To try and squeeze some more performance out of a retirement investing strategy that is heavily focused on buy & hold and asset allocation I am using a Cyclically Adjusted Price / Average 10 Year Earnings (PE10 or CAPE) ratio for the S&P 500 to value the US (specifically the S&P 500) stock market. The method used is that developed by Yale Professor Robert Shiller however I also incorporate earnings estimates up to the PE10 month of interest. Background information here.

Wednesday 21 April 2010

Australian (ASX 200) stock market including the cyclically adjusted price earnings ratio (PE10 or CAPE) – April 2010 Update

To try and squeeze some more performance out of a retirement investing strategy that is heavily focused on asset allocation I am using a cyclically adjusted PE ratio (known as the PE10 or CAPE) for the ASX 200 to attempt to value the Australian Stock Market. The method used is based on that developed by Yale Professor Robert Shiller for the S&P 500. I will call it the ASX 200 PE10 and it is the ratio of Real (ie after inflation) Monthly Prices and the 10 Year Real (ie after inflation) Average Earnings. For my Australian Equities I will use a nominal ASX 200 PE10 value of 16 to equate to when I hold 21% Australian Equities. On a linear scale I will target 30% less stocks when the ASX 200 PE10 = 26 and will own 30% more stocks when the ASX 200 PE10 = 6.

Saturday 17 April 2010

US (S&P 500) stock market including the cyclically adjusted price earnings ratio (PE10 or CAPE) – April 2010 Update

To try and squeeze some more performance out of a retirement investing strategy that is heavily focused on buy & hold and asset allocation I am using a Cyclically Adjusted Price / Average 10 Year Earnings (PE10 or CAPE) ratio for the S&P 500 to value the US (specifically the S&P 500) stock market. The method used is that developed by Yale Professor Robert Shiller however I also incorporate earnings estimates up to the PE10 month of interest. Background information here.

Sunday 21 March 2010

Australian Stock Market – March 2010 Update


To try and squeeze some more performance out of a retirement investing strategy that is heavily focused on asset allocation I am using a cyclically adjusted PE ratio (known as the PE10 or CAPE) for the ASX 200 to attempt to value the Australian Stock Market. The method used is based on that developed by Yale Professor Robert Shiller for the S&P 500. I will call it the ASX 200 PE10 and it is the ratio of Real (ie after inflation) Monthly Prices and the 10 Year Real (ie after inflation) Average Earnings. For my Australian Equities I will use a nominal ASX 200 PE10 value of 16 to equate to when I hold 21% Australian Equities. On a linear scale I will target 30% less stocks when the ASX 200 PE10 = 26 and will own 30% more stocks when the ASX 200 PE10 = 6.

Saturday 13 March 2010

US (S&P 500) Stock Market – March 2010 Update


To try and squeeze some more performance out of a retirement investing strategy that is heavily focused on buy & hold and asset allocation I am using a Cyclically Adjusted Price / Average 10 Year Earnings (PE10 or CAPE) ratio for the S&P 500 to value the US (specifically the S&P 500) stock market. The method used is that developed by Yale Professor Robert Shiller however I also incorporate earnings estimates up to the PE10 month of interest. Background information here.