Monday 8 December 2014

Saving Hard – We’re An Interesting Bunch

Thanks to all readers who took part in the earnings and savings poll.  The results make for some very interesting reading but before we go there let’s just take a second to review what we were really looking at with this poll.

I see three distinct phases when it comes to personal finance.  I summarise it as Save Hard, Invest Wisely and Retire Early but these phases could be called many things.  In a little more detail:
  • Save Hard is how we go about building capital that we can then deploy to investments that hopefully with time will give a return on that capital.  For me, and I'm sure many other readers, that is earnings from the day job that aren't spent on living today.
  • Invest Wisely is how we go about maximising the return on the capital we've built from Saving Hard.  For me that’s a balanced portfolio of different asset classes invested as tax effectively and at as low a cost as possible.
  • Retire Early is how big the capital pile needs to become before the goal is achieved.  For me I’m chasing enough wealth to be Financially Independent and have the option of Early Retirement but there are many other reasons why we might want to build capital.  Having a Retire Early reason is important.  Without it there is no reason to build the capital in the first place and you’re probably then just hoarding.
The polls were really looking at the Save Hard portion.  The first question asked was what are your gross annual earnings?  The results are surprising particularly when I chart them below against UK individuals who have some liability to income tax.  The surprising part is just how much we all earn.  For example 19.4% of us earn more than £100,000 a year!  In the UK that puts those readers in the top 2% of UK tax payers.  The median reader earns between £40k and £50k per year where across the UK median earnings are only £20,300.  A RIT.com median reader is earning somewhere between 2 and 2.5 times that of the UK as a whole!  The mode of readers is also £40k to £50k however across the UK it is only £10k to £20k.  These high earnings then give us all a fantastic chance to save if we live below our means and we don’t disappoint there.

Gross Annual Earnings
Click to enlarge

Saturday 29 November 2014

The Typical RIT.com Reader

When presenting my current financial situation or giving quantitative examples about financial problems (whether as thought experiments or actual experiences) regular readers will have probably noted that I typically always try and talk in percentage terms rather than absolute numbers.  Why do I do this?

Firstly, let me demonstrate what I’m talking about with a simple example.  Let’s say in Early Retirement I have calculated that my spending will be £20,000 per annum before tax and I've decided that I will drawdown on my wealth at the rate of 2.5%.  Running the maths tells me that I’ll need to accrue £20,000 / 2.5% = £800,000 of wealth before I'm financially independent and can take an early retirement that doesn't require any extra earnings other than those that come from the portfolio in the form of dividends, interest or capital gains.  I’m still a bit short of the target at the moment having only £500,000 stashed away in various asset classes.  There would be two ways I could present these facts:
  1. Simply state that I’m going to draw down at 2.5%, will therefore need £800,000 and have currently amassed £500,000; or
  2. State that I have now accrued 62.5% of the wealth I need to Retire Early which requires a little more work.  The calculation is simply £500,000 / £800,000 = 62.5%.  I choose to present this way.
So back to the original question, why only talk percentages rather than absolute numbers?  Simply because every reader including myself is an individual with different earnings, wealth targets, wealth requirements, needs and wants.  Therefore the fact that I have £500,000 currently invested is completely irrelevant to every reader but me.  However some of the principles or theories that I or other readers valuably contribute via the Comments could be very relevant making it worthwhile to go off and conduct further research.  What I have however found is that when I stray away from percentages the thought I’m trying to get across can be lost amongst the discussion about the numbers used.

Saturday 22 November 2014

It’s All About Living Well Below Your Means

I've mentioned previously in passing that as I build the wealth necessary to reach Early Financial Independence I'm noticing that the major wealth contributor for me has actually been the Saving Hard portion of my strategy rather than the Investing Wisely.

Let’s firstly quickly remind ourselves of what each portion contains.  Saving Hard is the methods used to acquire Capital for investment.  For me that is a full time professional career with Megacorp where I’m continually working to Earn More, as well as continually working on methods to spend less, while achieving the standard of living my family desires.  The spending less is typically called Living Below Your Means or LBYM in the financial independence blogosphere.  Investing Wisely is the methods used to maximise return on that Capital.  For me it includes low investment expenses, tax minimisation, modern portfolio theory, tweaking of asset allocations based on market valuations and even my HYP.

The below chart separates the wealth I've personally built each year from both Saving Hard and Investing Wisely.  Every year except 2012 more wealth has been built from Saving Hard.  It even includes the last couple of years where significant monthly savings are given to my better half so that Financial Independence day is synchronised.  So as I alluded to at the start of this post for somebody like myself who’s trying to become Financially Independent in 10 years or so Saving Hard is essential.

Year on year change in wealth
Click to enlarge

So Saving Hard is important.  Let’s look at each element in turn.  When it comes to Earning More I've been fortunate, having been able to increase earnings by 128% since 2007, however I can also say it has come at a price.  I am also very aware that in the modern continually globalising economic climate where average earnings in the UK are increasing at a less than inflation 1.3% this is currently not easy and importantly is not 100% in our control.  I'm going to ignore Earning More for the rest of this post for these reasons.

Saturday 1 November 2014

10 Habits to Become a Millionaire

Anton is a 27 year old dollar millionaire – at least in net wealth terms.  While he seems to have made about two thirds of that wealth through the US equivalent of leveraged Buy to Let property investment it’s still a pretty impressive feat.  Building that type of wealth in such a short time is not a lot different to what I’m trying to achieve, that is financial independence giving the option of early retirement in less than 10 years.  His 10 Habits That Made me a Millionaire post this week therefore intrigued me.  Let’s look at these 10 habits in turn and compare notes.

1. Setting Detailed and Actionable Goals

I have a proverbial shopping list of financial goals that I've set and then track myself against.  They cover everything from weekly targets for fuel economy on my monster commute and grocery shopping spend targets through to longer term goals including the amount of wealth I require for financial independence including timescales to get there.  I even go one step further and publically score myself against some of these goals at regular intervals.

2. Religiously Tracking My Net Worth

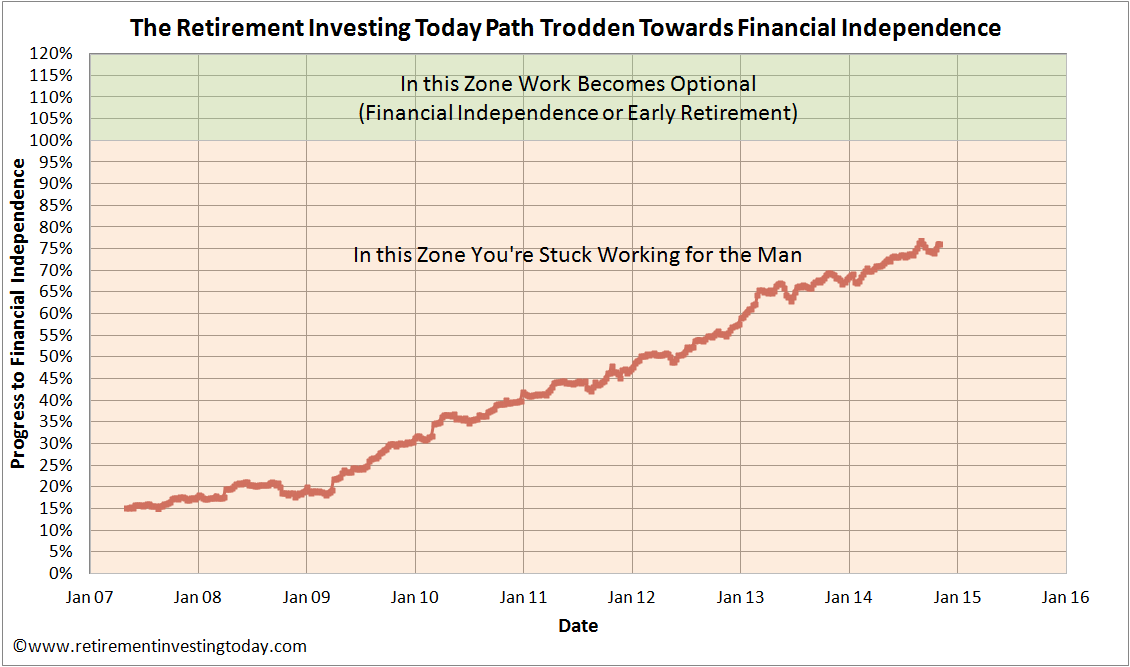
If you’re chasing financial independence then the buck stops at Net Worth.  I have recorded the values of every one of my investments which I then sum to give net worth every week since 2007.  I've never missed a week.  From that history I can then build charts like that below which track my progress to Financial Independence.  It also enables me to easily measure progress against my goals.

RIT Path Trodden to Financial Independence
Click to enlarge     

3. Having the Discipline to Save 60% of My Income

He doesn't say whether this is Gross or Net Income but for a long time I was saving 60% of the more difficult Gross.  I've had to recently relax that to 55% only because a recent healthy pay rise has pushed me well into Higher Rate Tax where including National Insurance I'm losing 42% which makes it impossible to save 60% of Gross.  With that in mind I'm declaring a pass against this habit.

Saturday 25 October 2014

Practice Makes Perfect

2007 was the year I started to Save Hard and Invest Wisely for Early Retirement. While today this is a mature strategy (with some 364 posts on this site reflecting that) back then I was an amateur who was reading continuously and running so many Excel simulations that I’m sure at one point I saw smoke rising from my computer.  As it was a year of transition and my financial record keeping was quite sketchy it’s quite difficult for me to say exactly when I started really following the strategy.  I do know that 2008 was the year where the strategy that you see today really matured and I also know that the 5th anniversary of RetirementInvestingToday.com will occur next month.  What however I don’t know is when I really “officially” started living most of the principles that are today mature.

What I do know is that by August 2007 I was already saving large chunks of money while spending little however throughout that month I was also still talking to Independent Financial Advisor’s, IFA’s, who at the time I thought were the secret to success but today firmly believe are not (at least for me, they may be for some).  I also know that it took me until the end of November 2007 to finally sell some funds that were charging me up to 1.78% in fund expenses per annum.  So the “real” Retirement Investing Today anniversary is probably somewhere between September and November.  Given we’re between those 2 dates today I’m going to call October 2007 the date when my journey really began.

October 2014 therefore represents the 7 year anniversary of my journey to financial independence and optional Early Retirement.  The question then becomes has 7 years of practice made perfect?  Well to answer that question I’ve just spent a couple of hours sorting through sketchy old records (this bit wasn’t by choice but rather my better half ‘encouraging’ me to participate in a very late spring clean) which really do make for interesting reading.

Sunday 19 October 2014

Valuing the UK Stock Market (FTSE 100) - October 2014

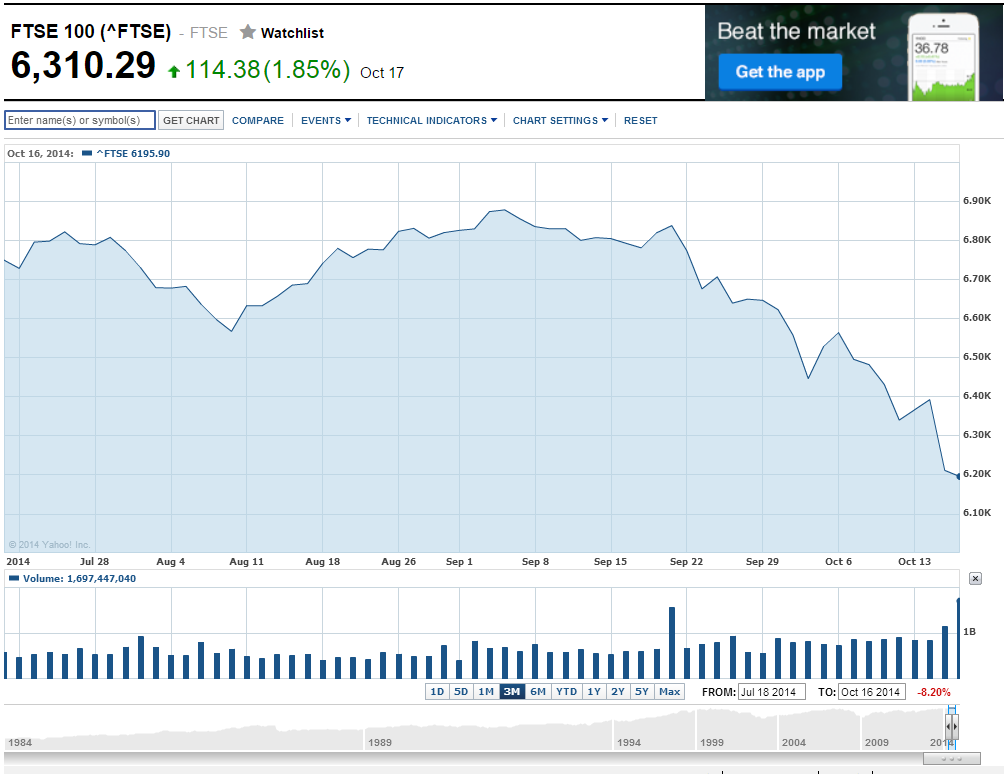
Over the past couple of weeks the mainstream media have been getting all excited about recent share price falls.  As a group of people who are paid to write stuff I guess you could easily get excited by a graph like this:

3 Month Chart of the FTSE 100 Price
Click to enlarge, Source: Yahoo Finance

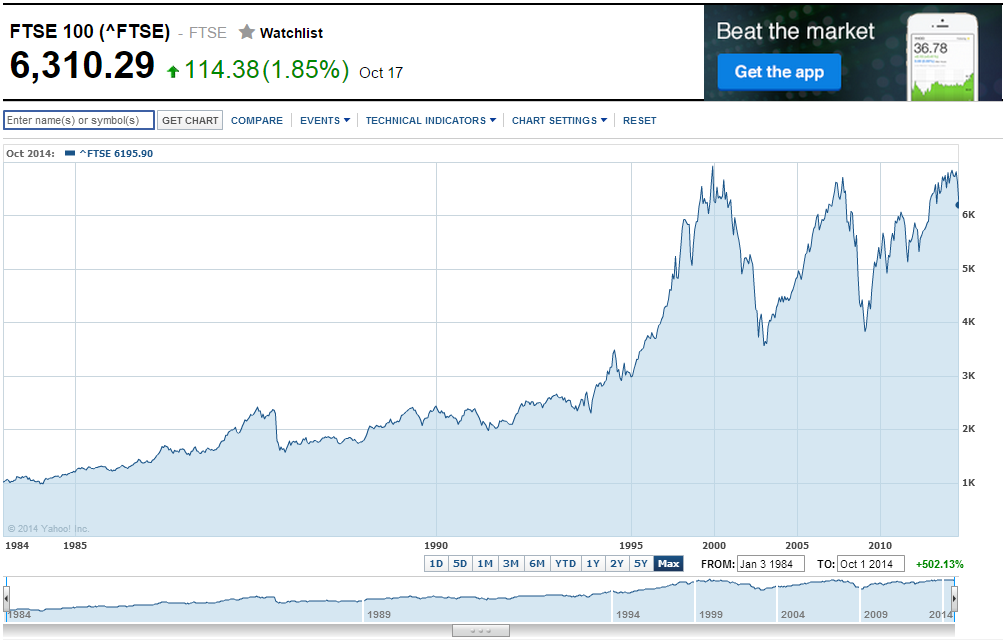
Eyeball this short term chart and of course they’re right.  Over the past 6 or so weeks there is no denying the FTSE100 has fallen 8% or so.  Personally, as a long term investor with a mechanical investment strategy I ignore it all and simply think that markets go up and they go down.  This is more the view I’m interested in looking at:

Chart of the FTSE 100 Price since 1984
Click to enlarge, Source: Yahoo Finance

On this scale the recent pull back is a bit of noise that means nothing more than my next share purchase is likely to be made at a better valuation than it was going to be.  Providing of course that earnings hold up.  Given I’ve now mentioned the valuation word as investors let’s today spend some time valuing the FTSE 100 over the longer term rather than wasting our time on short term price movement discussions.

Firstly let’s normalise the data by:

  • Correcting the chart for the devaluation of the £ through inflation.  For this dataset I use the Consumer Price Index (CPI) to devalue the £.
  • Plotting the Pricing on a logarithmic scale as opposed to a linear one.  By using this scale percentage changes in price appear the same.  

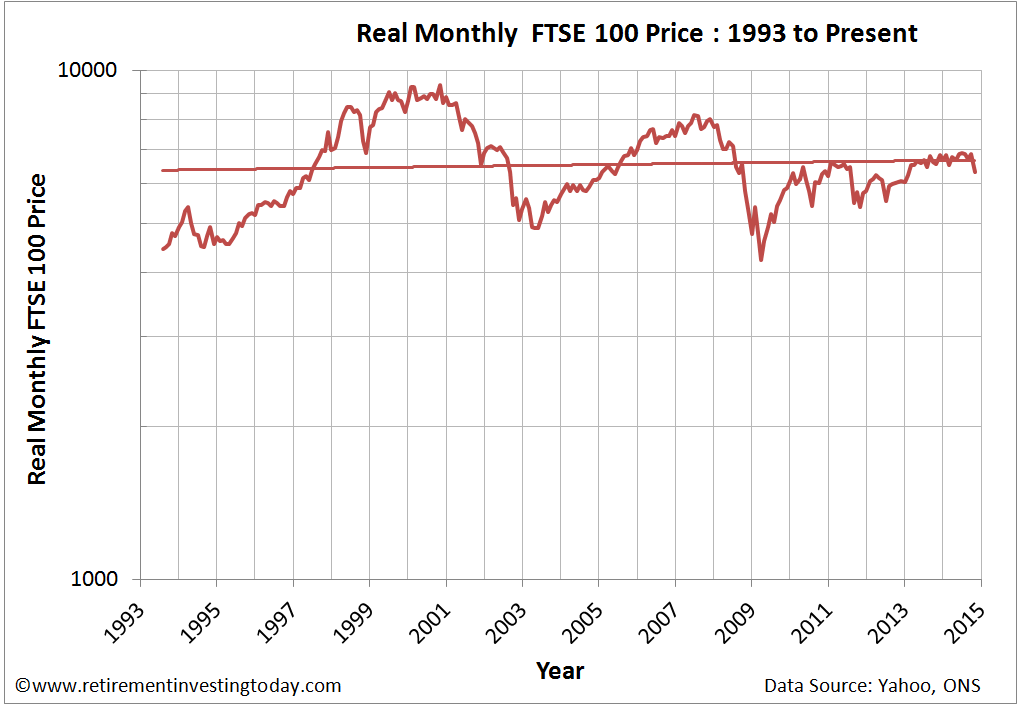
The normalised dataset shows that Friday’s FTSE 100 Price is actually still 32% below the Real high of 9,339 seen in October 2000.  We’re also now 23% below the last Real cycle high of 8,171 seen in June 2007.  We are therefore a long way from previous highs.

Chart of the Real FTSE100 Price
Click to enlarge

Sunday 12 October 2014

A Retirement Investing Today Review 9 Months into 2014

My personal finance life follows a Plan, Do, Check, Act (PDCA) approach.  As I do every quarter it’s time to Check whether my Save Hard, Invest Wisely to Retire Early Plan is working.  It’s important to highlight that unlike many blogs what I write here is a real life, my life, and very serious DIY experiment. If I get it wrong then it’s likely that a ‘derisory’ State Pension awaits.  If I get it right then the world (or Europe in my families case) is our oyster.

SAVE HARD

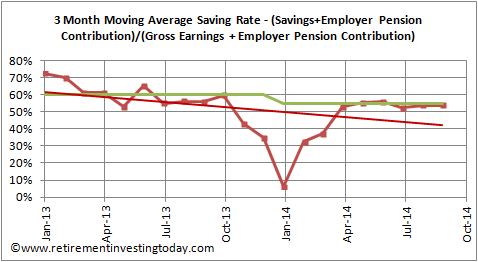
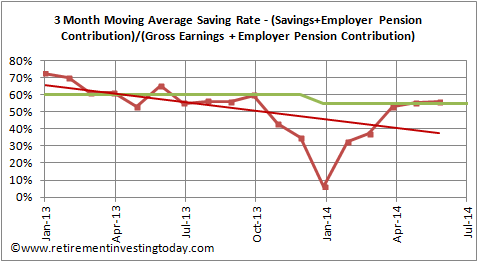
This quarter I've continued to work very long hours, including a long commute, while as a family we continue to challenge all spending to ensure that every £ will bring improved health and/or happiness.  If it won’t then we don’t spend on it.  The end result is a savings rate for the quarter of 54% of my earnings, where earnings are defined as my gross (ie before tax) earnings plus any employee pension contributions.  This is against a target of 55%.

For the non-regular readers my H2 2014 review details why the target is now 55% compared with 60% when I first started down this road.

RIT Savings Rate
Click to enlarge

Saving Hard score: Conceded Pass.  Close, but no cigar.  1% below target means a little more effort required as we head into the Christmas quarter.  A difficult challenge ahead.

INVEST WISELY

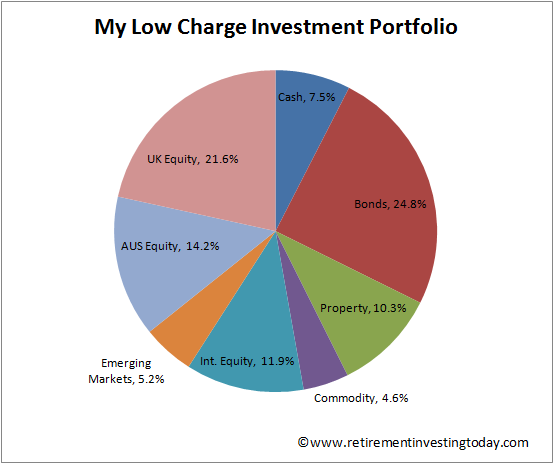
My investing strategy remains pretty much intact however with financial independence now fast approaching this quarter has triggered the need to now start increasing my cash holdings which when combined with my NS&I Index Linked Savings Certificates will eventually buy my family a home.  My current asset allocations are:

RIT Asset Allocations
Click to enlarge

A quick full disclosure in relation to a comment in that last link:  When I first started down this Retirement Investing Today road my family thought that Australia was a preferred early retirement location.  For that reason I divided the “domestic equities” portion of my portfolio equally between Australia and the UK.  That is no longer the case and so I am now actively and gradually reducing my Australia allocation by not investing new money into Australian equities as well as reinvesting Australian equity dividends elsewhere.  The sum of Australia and UK Equity is still aimed to be at target though which simply means my UK Equity portion will increase with time.

I continue to invest as tax efficiently as possible with my tax efficient holdings now consisting of:

  • 44.3% held within Pension Wrappers with the majority being within a SIPP
  • 14.4% held within the no longer available NS&I Index Linked Savings Certificates (ILSC’s)
  • 9.9% held within a Stocks and Shares ISA.  

Tax efficiency score: Conceded Pass.  At the end of June 2014 I was 68.9% tax efficiently invested.  In this quarter that has reduced slightly to 68.5% however with NS&I Index Linked Certificates currently unavailable and a definite unwillingness to expose myself much more to Pensions given the continual risk of government meddling I'm a little stuck.  If any readers have tax efficiency ideas I’d love to hear about them.

Saturday 4 October 2014

Investing mechanically with index trackers is boring

My retirement investment strategy has been relatively unchanged since I started this blog in 2009.  When you boil it all down around 90% of it is nothing more than a diversified portfolio of assets that do nothing more than track indices through the use of low cost ETF’s and funds.  Each month I add to this portfolio with new money and all I do is buy whichever asset class has been performing the worst (ie whichever class is most underweight).  Should an asset class ever deviate from its target holding by 25% then I would either buy or sell back to nominal holding.  This however seems to happen very infrequently because of my continual new money entering the portfolio

Let me demonstrate just how boring this all is.  It is the morning of the 3rd of October 2014 and already all of my mechanical index tracking investing decisions for the month have been completed.  This is what has occurred:
  • Last weekend, as I do every weekend, saw my Excel spreadsheet that shows my financial position and compares it to my long ago mechanically set target allocation updated.  Boring and absolutely no brain power required.  Total time spent 10 minutes.
  • My employer paid me on the last day of the month, Tuesday.  Total time spent to ensure money had cleared in my account was 5 minutes.
  • I’m a big believer in the Pay Yourself First mantra and I’m ruthless at it.  This means before I pay any bills, before I buy any food, before I do anything I Save Hard.  So with money in the bank and one eye on my Excel spreadsheet I knew I needed to allocate to cash and so 100% of my savings were moved over to RateSetter.  Total time to move my money and set-up an auto investment in their 3 year market at 5.0% was 5 minutes.  Again, boring and absolutely no brain power required.  
  • Over the next few days my employer will get around to salary sacrificing a big chunk of my salary into my employer selected defined contribution pension fund.  I know that my current set-up will have 20% of this invested into an Emerging Markets Index Tracker and 80% will go to an Index Linked Gilt Tracker.  Next weekend I’ll login to make sure that my employer has completed the transfer and the investment is correct.  Total time will be 5 minutes and again it will boring plus require absolutely no brain power.
By next weekend I will have spent 25 minutes managing what is now a very large amount of wealth.  I am also done until next month.  However while it’s incredibly boring and requires no brain power boy is it effective.  Having been at it for a few years I now honestly believe that this strategy is all that somebody needs to build wealth successfully.

Saturday 27 September 2014

How difficult is it to segregate our assets

In the modern, in my opinion overly complex, financial world there must by now be nearly as many investment risks as there are grains of sand on that now long forgotten Spanish beach where you spent your summer holiday.  One of these is that your broker/wrapper/online provider goes belly up and takes your wealth with it because they failed to segregate your assets from their own through fraud, negligence or even good old fashioned incompetence.  Here I am currently most exposed through my SIPP provider Youinvest, my ISA provider TD Direct, my trading account provider Hargreaves Lansdown and the large insurance company (the name of which I won’t mention as I could never recommend any element of their offering) who ‘looks after’ my defined contribution pension offered through my employer.

The same problem exists if the same fate befalls your fund manager.  Here I'm personally seeing significant exposure through Vanguard, State Street Global Advisors (SSgA) and BlackRock (think iShares).

It’s a risk I've known about for some time but on a scale of risks that I’m conscious of I had it ranked fairly low, thus wasn't doing too much about, as I thought that:

  1. The process of segregating your customers assets from your own really isn't very difficult so it should occur through negligence or incompetence very infrequently;
  2. Given its simplicity non-segregation would be easily and quickly identified by the firms accountants, compliance officers, auditors and/or regulator should it occur; and
  3. Non-segregated amounts, should they occur, would be relatively small in relation to total assets under management so result in only a relatively small loss given a large sum would be like an elephant standing in the room for those same accountants, compliance officers, auditors and/or regulators.


News this week tells me that my assumptions were naive and just plain wrong with Barclays investment arm having owned up to having “£16.5bn of clients' assets "at risk" between November 2007 and January 2012”.  This is neither a small amount of money nor a short period of time.  It also happened to occur during the period when Barclays was in severe financial difficulties and had to be ‘bailed out’ by the state investment funds and royal families of Qatar and Abu Dhabi to the tune of £7.3 billion.  It’s also not the only time with them having been penalised back in 2011 for “failing to ring-fence client money in one of its accounts for more than eight years”.  Of course Barclays say that ‘it did not profit from the issue and no customers lost out’ but they would say that wouldn't they and given the timing it could have easily been a very different story.

Saturday 6 September 2014

2 Years to Go

Only three weeks ago I was writing about my 75% of the wealth required to retire milestone and now as I sit writing this post, drinking a tasty homemade coffee which is helping me save hard ( ), it’s time to write about yet another.

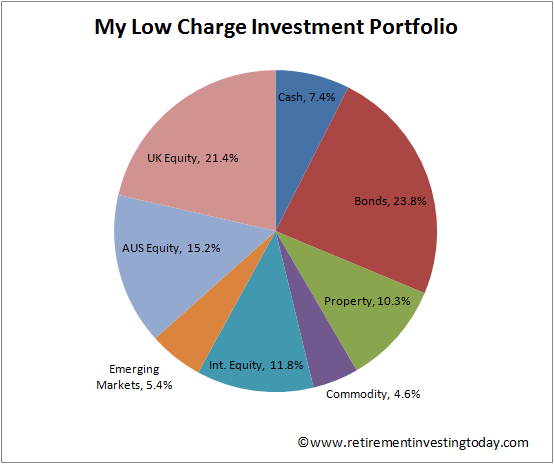
Today my top level asset allocation looks like this:

My Low Charge Investment Portfolio
 Click to enlarge

The detail behind this is still very much in line with my strategy that I first published in 2009.  Between the 04 January and 02 August 2014 (funny dates as I record my financial position weekly) this investing wisely portfolio returned 3.9%.  Move forward to today and that year to date return has morphed into 7.0% in around a month.  Should long run history repeat to average this portfolio should return about 4% per annum in real inflation adjusted terms over the long term (it’s returned exactly that since I started this journey in 2007) going forwards.

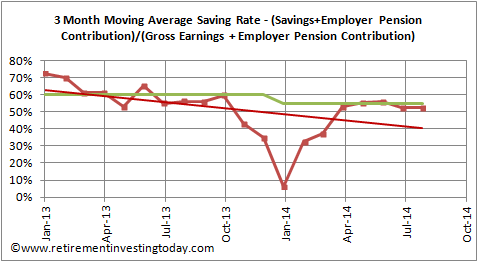
On top of that I continue to work on methods to save hard:

Average Savings Rate
Click to enlarge

Saturday 30 August 2014

Every little 0.01% helps

Today’s post title will possibly make High Yield Portfolio (HYP) advocates think I'm about to talk about Tesco’s (Ticker: TSCO) Friday action which included a 75% cut in the half-year dividend to 1.16p and a share price fall of 6.6%.  I'm not though because my own HYP contains alternate Sainsbury’s so I'm not (yet) affected plus there is already plenty of good blog coverage on the topic.

Instead I want to cover an important announcement that could with time save passive index investors a lot of money but which for some reason gained no MSM press inches that I'm aware of.  I don’t know why but the cynic in me thinks it could possibly be because the company that made the announcement doesn't advertise heavily and that is what much of the news is today – thinly veiled advertisements.  It was however picked up by the very astute non vested interest Monevator team.  Some Vanguard UK and Irish Domiciled Index Mutual Fund’s, ETF’s and LifeStrategy Fund’s have had their investment charges lowered.

Personally this affects me in the following ways:

  • I hold a lot of the Vanguard FTSE UK Equity Index Fund in my Youinvest SIPP.  Ongoing Charges on that fund from Monday reduce from 0.15% to 0.08%.
  • I hold the Vanguard S&P 500 UCITS ETF in my TD Direct NISA.  Ongoing Charges on that ETF will reduce from 0.09% to 0.07%.
  • I also hold the Vanguard FTSE Developed Europe UCITS ETF in my TD Direct NISA.  Ongoing Charges on that ETF will reduce from 0.15% to 0.12%.


Sunday 24 August 2014

The Two Phases of Wealth Building

Every week I religiously capture the value of each of my investments which I then sum to give me an instantaneous net worth.  This week saw my net worth increase by more than £5,000 without contributing any new money.  For me that is a very large amount of money, and of course Mr Market could take that £5,000 away this week, but it reminded me of the two phases of wealth building that I'm seeing as I'm working to build wealth over a quite short period of time.

The first phase is Building Capital.  As you start on your wealth building journey this is the first phase you pass through.  Here you just want to be adding as much capital to your wealth as quickly as you can get your hands on it.  Saving Hard by Earning More and/or Spending Less will have a much bigger effect in this phase than Investing Wisely.

The second phase is Return on Capital.  Here while Building Capital is still providing a big boost to your wealth it’s now more important to have a stable investment strategy which is very tax and investment expense efficient.  In this phase you could even start to ease of the Saving Hard by for example going part time or taking up that lower paid higher enjoyment opportunity you’ve always desired without moving your financial independence day greatly.

Let me demonstrate the two phases with a simple example (where I’ll ignore inflation) that tries to cover many of the points that I personally live (and have lived) as well as regularly capture on this site.  Average Joe works hard and for his hard work receives £45,000 per year making him a 40% higher rate taxpayer.  Joe wants early financial independence to give the option of early retirement and so starts to think about he might achieve that.  He realises he firstly needs to focus on Building Capital by Saving Hard.  His employer offers a pension scheme where if Joe salary sacrifices 5% of his own salary then they will match it.  There’s some free money there so he goes for it.  Salary sacrificing also brings the benefit of lowering Joe’s taxable salary to £42,750 saving both employee and employer National Insurance.  Joe’s employee NI saved is added immediately to his pension but his employer also generously adds the 13.8% employer NI that they also save.

Sunday 17 August 2014

A Significant Milestone

Noel Whittaker in his book Making Money Made Simple states that in a country such as the UK (he actually cites Australia as an example) “the average person needs only two things to become wealthy – the knowledge of what to do, and the discipline to practise the things that need to be done.”  When put that way it sounds so simple (and of course it is) however reality is of course a different story all together particularly when I look back at my own potted history.

I graduated and started work in 1995.  Almost instantaneously I took on plenty of debt in the form of a car loan and was quick to ramp my standard of living by spending nearly everything I earned (I did save a small amount into an employer pension but it was nothing more than the default fund).  It actually took me until 2002 to make a small purchase into my first investment fund which was not part of any overall strategy but simply a random purchase.  I can’t even remember what prompted the purchase but it certainly wasn’t the “knowledge of what to do”.   It was a great selection [sic] with annual expenses of 1.78% along with a 4% contribution fee.  Hardly the road to wealth.

It actually took me until 2007 to wake up and start to figure out what the game was all about which is when my wealth building journey to financial independence really started.  It was in this same year I bought my first tracker - a FTSE All Share Tracker Fund.  That is 12 years from when I started earning a full time salary to even begin to have the personal finance “knowledge of what to do”.

Saturday 2 August 2014

The RIT High Yield Portfolio (HYP) – Adding GlaxoSmithKline

I’ve now been building my High Yield Portfolio since November 2011.  A reminder of my previous purchases:


The experience continues to be positive with the HYP as of Friday (excluding the GSK purchase) sitting on a trailing dividend yield of 4.6% compared to the FTSE 100 dividend yield of 3.3%.  At the same time the HYP is also outperforming the FTSE 100 from a capital growth perspective.  Year to date capital growth of the HYP is down 0.6% compared to the FTSE 100 which is down 1.0%.  Since inception the HYP has grown 35.4% compared to the FTSE 100’s 25.7%.

Wealth Warning: I don’t know if long term this HYP strategy will work.  There is every chance that a simple diversified portfolio of lowest expense index trackers that are invested tax effectively will in the long term outperform this strategy.  Only time will tell. 

Buying GlaxoSmithKline

So with hundreds of shares to choose from I grabbed GSK on Friday.  Let’s review why by sharing my usual selection criteria.  At the same time let’s also have a quick look at how HYP’able my current holdings also look today.

1. Is the business model simple to understand?

The first criteria is qualitative.  I want to understand how the business I’m buying makes its revenues in less than 10 seconds.  GSK and its brands hardly need an introduction.  They are a global pharmaceutical and healthcare company developing and supplying medicines to help people do more, feel better and live longer.  They make everything from Ventolin which any asthma sufferer will likely know well, through remedies such as Beechams Cold & Flu and onwards to day to day brands such as Macleans toothpaste.  They even own the Horlicks brand.  This is simple to explain and understand so meets my first criteria.

Saturday 26 July 2014

Freedom and Choice in UK Pensions : It’s Not All Good News for Responsible UK Personal Pension Holders

As part of the UK Budget 2014 George Osborne briefly announced the next tranche of government pension tinkering.  More detail in the form of the fifty page document entitled Freedom and choice in pensions : government response to the consultation has just been published so let’s briefly look at what I think is the good, the bad and the ugly as far as I'm concerned.

The Good

The Budget included the announcement that from April 2015 pension holders would get unrestricted access to their personal pension savings.  The mainstream media became all excited and started talking about people cashing in the lot and buying Lamborghini’s.  I ignored this nonsense and thought it actually might give responsible people (like myself?) who are saving for their future an intangible benefit so have been keenly waiting for the detail.

I currently have 44% of my wealth tied up in Pension Wrappers as they have the potential to (I say ‘have the potential to’ and not ‘will’ as once you’re in it’s difficult to get out again without punitive taxes and governments are guaranteed to continue to tinker) give me a healthy reduction in tax over my lifetime.  This comes from a few areas:
  • As a Higher Rate taxpayer while working but expecting to be a Basic Rate taxpayer in retirement I’m avoiding 40% tax now in exchange for 20% tax as I start to withdraw from my pension.
  • By salary sacrificing I’m also getting the employee national insurance that would have been paid on the sacrificed amount added into my pension as well as the majority of the 13.8% my employer saves by not having to pay employers national insurance on the scarified amount.
  • Being able to take a 25% tax free lump sum at retirement. 

Saturday 19 July 2014

Best UK Savings Account Interest Rates & The RateSetter Experiment

I have been using Yorkshire Building Society (YBS) as my Savings Account provider for a few years now.  While once at the top of the best buy league they haven’t been there for some time now.  They have however always been pretty close from an interest rate perspective and have been no nonsense from a T&C’s perspective.  I was receiving 1.5% AER meaning as Higher Rate Tax payer and with inflation running at 2.6% I was receiving a Real interest rate of -1.7%.  In other words every pound sitting in YBS was being devalued monthly.

Recently, they have sent me a letter which starts out with “As your building society, you'll know that we have a tradition of looking after all our customers with good value products and great service...” Great start but of course the small print advised that they were further reducing my savings account interest rate to 1.25% AER.

Of course I’m not surprised given the latest average savings account data from the Bank of England shown in the chart below which show instant access savings rates down 0.27% in the last year.

Average UK Savings Account Interest Rates
Click to enlarge

Going to the market for the latest best buy savings accounts reveals very little.  Moneysavingexpert.com recommends the Santander 123 current account which has sliding scale interest rates (between 0% and 3% AER), a monthly fee and minimum deposit requirements.  The best clean rate looks to be Britannia or Coventry BS with a 1.4% interest rate but these accounts can’t be run online.

Saturday 12 July 2014

A Retirement Investing Today Review 6 Months into 2014

The June distribution laggards have now paid up so let’s take a pause to validate whether the tools and techniques from this site actually work in the real world.  This is achieved by my living the Save Hard, Invest Wisely, Retire Early mantra.  I'm a real life guinea pig putting my own money where my mouth is.  A mistake in one of my concepts could affect not only me but also my family greatly.

SAVE HARD

It’s now my sixth year of aiming to save 60% of my earnings, where earnings are defined as my gross (ie before tax) earnings plus any employee pension contributions.  Changes over the past six months mean that this target is now out of reach and a revision to a 55% target is needed.  Before you start flaming me I confirm that I haven’t been a hypocrite and started a consumerist lifestyle.  Instead the change has been caused by a healthy salary increase which is taxed at the 40% Higher Rate plus 2% National Insurance making 58% the most I could save from this new money.  Additionally, to keep my better half and I on the same financial independence trajectory this increase means I now need to cover all of the household costs as well as direct some of my savings to my better half’s investment portfolio.

In addition this half year saw HM Revenue and Customs change tune and make some aggressive demands for a tax error that they made in the 2012/13 tax year which enabled me to regularly save in the high sixties/low seventies.

RIT Savings Rate
Click to enlarge

Saving hard first half score: Conceded Pass.  Without the HMRC recovery, which I’d already saved in previous periods, the savings rate would have been held.  Since sorting this the new 55% savings rate has been sustained.

Wednesday 2 July 2014

A Sobering Income Drawdown Demonstration One Year On

When we left our UK Invested Income Drawdown dependent Retiree’s a year ago there was trouble afoot.  Our 4% Withdrawal Rate Retiree, which remember is the Safe Withdrawal Rate (SWR) Rule of Thumb many talk about and even use, was particularly vulnerable having lost between 11% and 24% of wealth in only 6.5 years.  Since then a couple of notable things have occurred:

  • The 2014 budget saw the income drawdown rules again altered.  From the 27 March 2014 retiree’s are now able to withdraw from their pensions at the rate of 150% of the Government Actuary’s Department Tables (GAD Tables).  Additionally flexible drawdown, allowing unlimited withdrawals from your pension pot, is now available for anybody with a guaranteed income of £12,000.  Then from April 2015 these rules will change again and allow unlimited access to our pensions from age 55.
  • The second is that Professor Wade Pfau published research showing a UK retiree positioned with a 50% UK Equities/50% UK Bonds portfolio and drawing down using the 4% SWR rule of thumb would actually run out of wealth 23.8% of the time within a 30 year period.  Scary stuff given how loosely the 4% Rule is bandied around the personal finance blog world these days.  Professor Pfau then calculated that if history should repeat (and of course past performance is not necessarily indicative of future results) then to ensure you don’t run out of money over a 30 year period your withdrawal rate before investment expenses and taxes are deducted has to actually be less than 3.05%. 


Going forwards this is going to make life interesting.  For a retiree to draw down £24,856, the equivalent of current average UK earnings (Office for National Statistics KAB9 dataset), requires wealth (including Pensions, ISA’s and non-tax efficient investments) of £814,950 if we are to minimise depletion risk over 30 years according to Pfau’s research.  At the same time from next year we can grab whatever we like from a pension pot that on average only contains £36,800 at retirement according to the Association of British Insurers.  Of course many of us don’t just save in pensions (for example only 43% of my wealth is in a Pension of which only 14% is sitting with expensive inflexible insurance companies) and of course not all of us will withdraw crazy amounts to buy Lamborghinis (if the rules haven’t changed I’ll be withdrawing as much as possible to keep my total earnings just below the Higher Rate tax limit with the difference between spending and withdrawal being put into an ISA) but it’s probably uncontroversial to suggest it does have the potential to leave the uneducated very exposed.

With that in mind let’s look at how our UK Invested Income Drawdown dependent Retiree’s are doing one year on.  For consistency all assumptions are unchanged.  Re-emphasising some of these assumptions:

  • Our Retiree’s are drawing down at the stated withdrawal rate plus investment expenses.  This means any trading commissions, wrapper fees, buy/sell spreads and taxes have to be paid out of the earnings taken.  For example, our 2% Initial Withdrawal Rate Retiree is actually drawings down at between 2.25% and 2.36% dependent on the asset allocation selected.   
  • All calculations are in real (inflation adjusted) terms meaning that a £ in 2006 is equal to a £ today.
  • 6 Simple UK Equity / UK Bond Portfolio’s are simulated for our retiree.  The UK Equities portion is always the FTSE 100 where the iShares FTSE 100 ETF (ISF) is used as the proxy.  For the bonds portion a simulation is run against UK Gilts (FTSE Actuaries Government Securities UK Gilts All Stock Index) where the iShares FTSE UK All Stocks Gilt ETF (IGLT) is used as the proxy and the bond type I prefer in my own portfolio, UK Index Linked Gilts (Barclays UK Government Inflation-Linked Bond Index), where the iShares Barclays £ Index-Linked Gilts ETF (INXG) is used as the proxy.
  • The wealth accrued at retirement (the 31 December 2006) is £100,000.  To simulate a larger or smaller amount of wealth just multiple by a constant. For example if you want our retiree to have £600,000 just multiply all the subsequent pound values by 6.


Monday 30 June 2014

The RIT High Yield Portfolio (HYP) – Update and Adding PSON and RDSB

When I reach Financial Independence in less than 3 years I'm going to be presented with a number of options, one of which will be to take Early Retirement.  Should I take that option I've already telegraphed that based on my current research I will start withdrawing from my wealth at the rate of 2.5% of total net worth on retirement day.  Ideally, this strategy will have then given me the option to increase my spending at the rate of inflation annually while ensuring the pot of gold at the end of the rainbow is never extinguished.  Of course I won’t blindly follow this strategy but will instead monitor closely and should that black swan arrive will cut my cloth accordingly.

As the do I take Early Retirement question looms I also want to make sure I have sufficient confidence in my financial situation that I don’t fall into One More Year (OMY) Syndrome but instead make the decision on will I or won’t I for purely non-financial reasons.  One thing that would build financial confidence and hence take some of the do I have enough doubt away was if my dividends and interest being earned across my portfolio exceeded the withdrawal rate from the portfolio allowing some reinvestment even in retirement.  Were I to retire today I estimate that after purchasing a home and moving my employer defined contribution pension into my SIPP my dividend plus interest yield would be 2.53%.  So right on the targeted drawdown amount.  Continuing to build my High Yield Portfolio (HYP) should increase that percentage.

Saturday 21 June 2014

The Buck Stops Here

Some might think this post a little cynical however I've found that it sometimes pays to be a little cynical so here goes.  Businesses and their marketing machines have few goals on their mind.  One of those is to remove as many pounds and pence from your pocket as legally possible.  Ideally they then get to do this more than once.  They then try and get you not to notice how many notes and coins you’re counting out by bringing other businesses into the game that can help you to pay the original business in one electronic form or another.  They certainly don’t assess whether the purchase will benefit you or your family’s life.  It’s nothing personal.  It’s simply maximising the revenue.

Once those businesses have completely emptied your pocket worry not.  That’s because another business will come along who will provide you with a product of one type or another that will allow those previous businesses to remove pounds and pence that aren't even yet in your pocket.  They also don’t assess whether the purchase will benefit you or your family’s life and are again simply looking to maximise the revenue.  It’s nothing personal.  It’s simply maximising the revenue.

You might even work for one of those businesses.  Again, they are not interested in whether the salary paid brings benefit to your family’s life or if you need additional State support simply to exist.  They are simply trying to pay you and all your colleagues the least amount possible that will prevent empty desks either in the form of people leaving and/or new people not joining.  If this should occur then some other business will maximise the revenue at their cost.  It’s nothing personal.  It’s simply maximising the revenue and profit.

Saturday 14 June 2014

The Path to Early Financial Freedom, Bicycles Optional

VW Polo SE Bluemotion
In my hunt for Early Financial Independence, maybe even Early Retirement, I'm unrelenting in my efforts to minimise my spending while not sacrificing the elements of family life that are really important to us.  This is essential behaviour as finding ways to minimise spending allows two things to occur:

  • the reduction in spending allows another advance towards the Financial Independence goal  because it can directly become savings; and
  • importantly by spending less the Financial Independence goal posts also move towards you.


There is however one area where this is not an appropriate course of action – spending required to earn money.  Generally, if you were just looking to minimise spending you’d be looking for the highest paying job where housing costs were low and your home would be within a walk or cycle to work.  Other considerations for some might include minimising child care or ‘uniform’ costs to name but two.  In the extreme this would be home working.  This is of course flawed because we need to actually be finding ways to Save Hard and not just spend less.  The mathematical way to think about it is Saving Hard is maximised by maximising earnings (which in a family unit could be 2 or more salaries), minus tax, minus national insurance, minus spending required to earn.  Of course it’s then appropriate to be unrelenting in your efforts to minimise your spending required to earn.

Saturday 7 June 2014

Valuing the UK Stock Market (FTSE 100) - June 2014

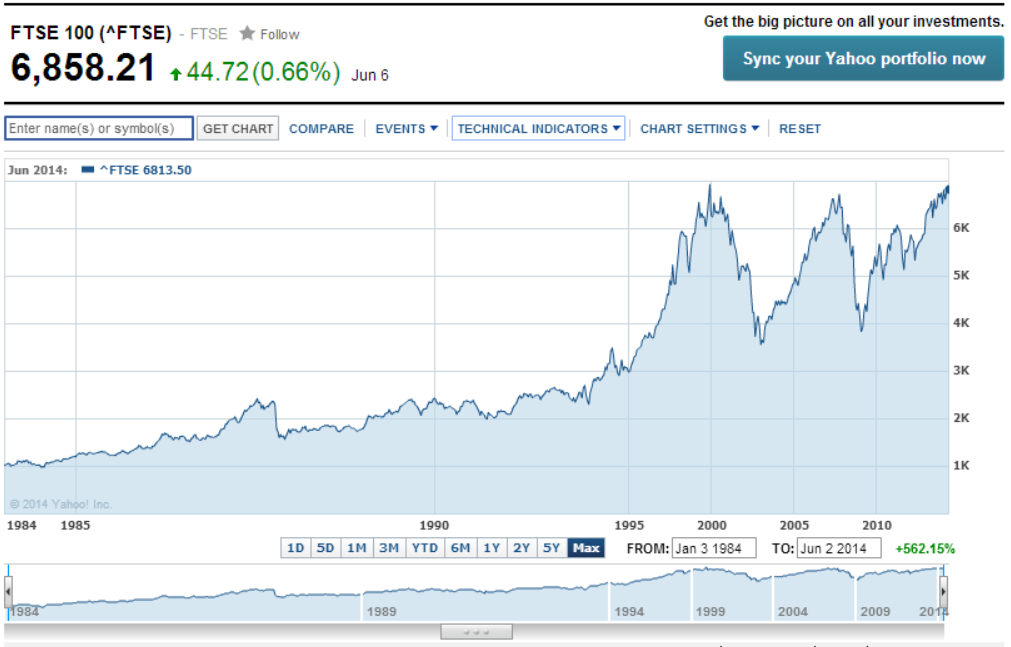
When nominal charts of the FTSE100 start looking like this:

Chart of the FTSE 100 Price
Click to enlarge, Source: Yahoo Finance

Which are showing us being within 1% of the nominal 30 December 1999 record high of 6930, the chatter in the mainstream media about the potential to reach new highs kicks off.

So what do I think about the potential to reach new highs?  Well I don’t actually even waste brain power considering it for a few reasons:

  • The most important is that my investment strategy is no longer based on any form of emotion but is instead now purely mechanical.  This was done because early on in my DIY investing career I realised that no matter how much energy I expended I actually had no idea whether the market was going to go up, down or sideways.  A lot of people out there do claim to know but from what I can see most of these seem to make their money by commenting on it in the media, writing books on the topic or by selling investing newsletters.  If they really do know why are they expending energy doing this rather than making a fortune trading with this great knowledge?  I really do now believe that unless you have inside knowledge, which you can’t profit on legally, then they are all actually just like me.  They have no idea. 
  • As I’ll show in this post the market is actually nowhere near a new high.
  • Again, as I’ll show in this post, while I believe the market is slightly overvalued it’s still only in the bottom 17% of monthly valuations since 1993.   


Let’s run the numbers.  Firstly we’ll remove the excitement and normalise the data by:

  • Correcting the chart for the devaluation of the £ through inflation.  For this dataset I use the Consumer Price Index (CPI) to devalue the £.
  • Plotting the Pricing on a logarithmic scale as opposed to a linear one.  By using this scale percentage changes in price appear the same.  


Monday 26 May 2014

Further Exploration of Safe Withdrawal Rates (SWR) for UK Investors

If you’re like me and don’t have a Final Salary Pension waiting in the wings, rich parents (which might include an inheritance), intention to buy an annuity and don’t want to be raiding bins for food scraps in old age then the amount of wealth you accrue before calling yourself financially independent, allowing early retirement is a critical number that you really can’t afford to get wrong.  Retire with too little wealth and you could expend it all before parting from this fair land making life in old age very difficult.  Be too conservative and fall into the “one more year of work” syndrome and well all I can say is you’re a long time dead.  So we’re looking for a Goldilocks amount of assets.  Let’s try and figure out what that amount might be for a UK resident.

Given the seriousness of the topic I must give the following Wealth Warning before we move on.  I’m just an average person on a DIY Investment journey to Financial Independence and am certainly not a Financial Planner.  The content of this post is for educational purposes only and is not a recommendation of any type.

We've looked at Safe Withdrawal Rates previously.  In that post we focused on the 4% Rule or 4% Safe Withdrawal Rate (SWR) which in brief works on the principle that if in your first year of retirement you withdraw 4% of your portfolio, then yearly up rate your withdrawals (your “Gross Earnings” plus any investment expenses) by inflation, the end result will be that you won’t exhaust your portfolio in your lifetime.  If you dig a little deeper what it actually says is that using past market performance (which we of course we know does not necessarily predict future market results) for a 50:50 Stocks : Bonds portfolio then you have a 96% of not expending your portfolio in a 30 year period.

Wednesday 21 May 2014

Real Life Portfolio Performance

As I sit here writing this post the Excel spreadsheet that I use to track my wealth and portfolio performance tells me that I have accrued 76.1% of the wealth that I require for Financial Independence (and Early Retirement if I should choose to retire from work).  If there is one thing I've learnt over the 7 and a bit years that I've been accruing that wealth it is that if you want to be the person who retires by 40, who makes early retirement extreme work or who reaches financial independence in 10 years and not the one who retires when the government tells you to then you need to not only be tenacious and not blow with the wind but also rigorously PDCA (Plan, Do, Check, Act).

When I say this I'm not saying to continually alter your investment strategy to today’s new fad.  That’s just going to lead you astray and hinder your wealth creation.  Instead it’s going to have to be far more subtle and purposeful than that but it’s important because I can guarantee, if my example is anything to go, that a large portion of both your life and investments are going to be different from what you originally planned.  Therefore to reach your goal some course correction is going to be required.  Let me maybe demonstrate the principle with some personal examples:

  • When I first went DIY in 2007 I was naive and really in a state of investment strategy flux as I learnt.  By 2009 the foundation of my strategy was built but it actually took until late 2011 to reach maturity with the addition of a High Yield Portfolio (HYP) portion.  As I move quickly forward to Financial Independence then I can see some more subtle change as I work to build regular income streams from areas like extending the HYP portion of my portfolio.
  • When I started out Vanguard didn't exist in the UK.  They were of course big in the US but didn't actually come to the UK until 2009.  Vanguard funds and ETF’s now form a cornerstone of my portfolio lowering my investment costs.
  • By 2010 I had cottoned onto the need to save hard, by both maximising income and minimising spend, and was regularly saving 60% of my gross earnings plus employee pension contributions.  That quickly moved to 2011 when I was without work.  Onto today and my family life has changed such that to maximise the benefit to the family I am paying all the family bills meaning over the last 15 months my savings rate has now fallen to an average of 50%.  Within this 50% I'm also making significant contributions to help my better half’s wealth (not detailed on Retirement Investing Today) to grow as quickly as my own meaning my wealth growth rate will also slow from what was planned.  To keep to plan I've had to work hard to continually increase earnings but also reduce costs through these changes. 
  • In recent times we've seen and are seeing a lot of post Retail Distribution Review (RDR) change within the investment world.  It looks to now be stabilising and while I've generally not come out of it all too badly I am considering a shift away from Youinvest for my SIPP to again lower investment costs.
  • The market moves and I respond with rebalancing according to my strategy as well as continually buying the most under performing asset class with new money.


Thursday 15 May 2014

Valuing the Property of England and Wales at County Level – Year 2

This time last year I introduced a house valuation metric that went beyond the usual whole of United Kingdom or England and Wales discussion carried by the mainstream media.  Instead I dissected both the salaries and house prices of England and Wales to prepare a valuation covering each County.  It showed some interesting results including nearly a factor of four between the best valued and the most over valued County.  Additionally, there was an obvious North and Wales to South divide when it came to house values.  We are now 1 year on so today let’s look at what’s changed.

To Value the market we will stay with our previous definition which is a simple Price to Earnings Ratio (P/E).  For House Prices we will stay with the Land Registry House Price Index.  As a reminder this index uses repeat sales regression on houses which have been sold more than once to calculate an increase or decrease.  As it analyses each house and compares the latest buying price to the previous buying price it is by definition mix adjusting its data also.  This is then combined with a Geometric Mean price which was taken in April 2000 to calculate the index.  It is seasonally adjusted and covers properties from England and Wales.  It covers buyers using both cash and mortgages.  We are using the latest published data which comes from March 2014.  The analysis is arranged according to the Regions and County’s defined by the Land Registry and is shown in the Table below.  Unlike the mainstream media we are going to call high house prices bad (the County with the highest house price is London at £414,490 and is shown in dark red) and low house prices good (the County with the lowest house price is Merthyr Tydfil at £59,041 and is dark green) with all other prices shaded between red and green depending on house price.

For Earnings we just move the dataset on one year and today are using the 2013 Annual Survey of Hours and Earnings (ASHE) which provides information about the levels, distribution and make-up of earnings and hours paid for employees within industries, occupations and regions in the UK.  To ensure that our Earners and Houses are located within the same County we’ll stay using the Earnings by Place of Residence by Local Authority.  This dataset presents weekly Earnings at both median (the middle point from each distribution) and mean (the average) levels which we have arranged into each Land Registry Region and County in the Table below.  We then multiply the data by 52 weeks to convert it to an annual salary.  We are calling low earnings bad (the lowest average earnings are £16,999 in Blackpool and are dark red) and high earnings good (the highest average earnings are £36,956 in Windsor and Maidenhead and are dark green) with all other earnings shaded between red and green depending on earnings.