Sunday 1 July 2012

Introducing the Greater Fool UK House Price Index

I now track 4 UK house price data sets.  These are:
-    The Rightmove House Price Index.  This index tracks asking prices of properties as they come onto the market.  Rightmove claims their dataset covers over 90% of the market so you would expect it to be pretty accurate in terms of seller’s first expectations of what they will achieve for their property.  The dataset is not seasonally adjusted.
-    The Halifax House Price Index.  This index is based on loan approvals agreed by Halifax Bank of Scotland.  The dataset that I use is the not seasonally adjusted, All Houses, All Buyers set.
-    The Nationwide House Price Index.  This index is based on loan approvals agreed by Nationwide Building Society.  I use the actual Average House Prices presented and so am using a not seasonally adjusted dataset.
-    The Land Registry House Price Index.  This contains the house prices for all transactions in England and Wales.  This includes both mortgages (which the Halifax and Nationwide would be included within) and non-mortgages (cash transactions).

Thursday 28 June 2012

UK Average Weekly Earnings – June 2012 Update

The Office for National Statistics reports that the Average Weekly Earnings for the Whole Economy including bonuses and allowing for seasonal adjustment is now £467.  This is £1 more than the previous month and annualised is £24,284.  Breaking this figure down between the Public Sector and the Private Sector reveals the Public Sector to be still coming out on top by some 3%.  The Average Public Sector employee earns £479 per week compared to that of the Private Sector which funds those earnings (of course in conjunction with a lot of government borrowing) at £465.

Sunday 24 June 2012

The S&P 500 Cyclically Adjusted PE (aka S&P 500 or Shiller PE10 or CAPE) – June 2012 Update

The S&P 500 closed on Friday at 1,335.  By my calculations I also have as Reported Earnings (using a combination of actual and estimated earnings) at $92.33.  Combining these two pieces of data gives us an S&P 500 P/E Ratio of 14.5. 

While interesting, for my own investment purposes, I do not use the P/E ratio.  Instead I use what I have called the Shiller PE10 which is shown in my first chart (effectively an S&P 500 cyclically adjusted PE or CAPE for short).  This method is used and was made famous by Professor Robert Shiller.  It is simply the ratio of Real (ie after inflation) S&P 500 Monthly Prices to 10 Year Real (ie after inflation) Average Earnings.

Tuesday 19 June 2012

UK Inflation - May 2012

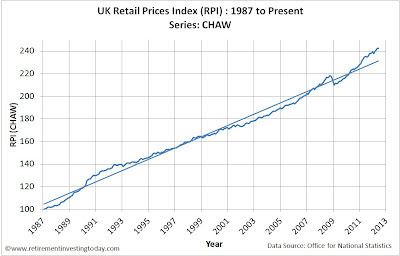
Today’s post looks at UK Inflation and specifically the Retail Prices Index (RPI) and the Consumer Prices Index (CPI).  It is not the most exciting post that I write, however it is an important piece of data for us to look at as it is needed to run a lot of the analysis that you see on Retirement Investing Today.  At this point in time the RPI is changing year on year at the rate of 3.1% with the index itself shown in my first chart.  This chart clearly shows the index still trending away from the long run trendline.

My second chart shows the annualised change in the RPI on a quarterly, six monthly and annual basis.  On an annualised quarterly basis we are seeing inflation still high at 4.2%. 

Sunday 17 June 2012

Average UK Savings Account Interest Rates – June 2012 Update

The interest paid on savings accounts is important to a lot of UK investors.  A quick look at Money Saving Expert shows us that if today you were in the market for an instant access account and were prepared to accept a little account complexity, including a big reduction in interest paid within a year or so, you could get savings interest of: 
-    3.2% AER variable with Santander.   Forget to switch in 12 months to the new highest rate bank and this becomes 0.5%.
-    3.17% AER with the Post Office.  Forget about this one and in 12 months you’re at 1.65%.
-    3.1% AER with the Nottingham Building Society.  This one works a bit differently.  If you close the account before the 30 September 2013 you only get 1% and after this date you also only get 1%.

Of course banks like Santander, rely on the vast majority of the Average Joe’s and Jane’s out there forgetting to switch after 12 months, at which point you’re quickly penalised.  Let’s say you start one of these savings accounts but then get distracted and only remember to switch to the new best offering in 15 months.  That 3.2% which looked ok has now become effectively 2.7%.  Leave it 18 months and you’re now at an effective rate of 2.3%.