

Friday 27 August 2010
Alternatives to NS&I Index Linked Savings Certificates? – July 2010 Update
Wednesday 25 August 2010
If this is true then the US (and the UK for that matter) is doomed

I was reading the BBC article “US existing home sales drop to 10-year low” which was discussing the 27.2% fall in US existing homes during July compared to June. Of course the government were blamed because they ended tax credits designed to boost home sales. I could today talk about why the government are even in the market trying to boost sales when it should be a free market that is not manipulated. But I won’t because I came across a couple of quotes from Carey Leahey at Decision Economics which concerned me greatly. These were "I think [the July figure] is just suggestive of an economy that is definitely slowing down" and "unfortunately, it is a situation where we can't have a meaningful recovery without a meaningful consumer recovery, and we can't have a meaningful consumer recovery without a recovery in housing."
Monday 23 August 2010
The lowest cost low cost SIPP
My employer offers a money purchase pension scheme administered through a large UK based insurance company. I have been making substantial contributions into this scheme over the last few years which now means that it makes up 31.7% of my Retirement Investing Low Charge Portfolio. In my opinion my employer is very generous with the salary sacrifice scheme they offer as they match my contributions up to a certain limit plus they also contribute the employers national insurance that they save through the salary sacrifice. In addition as a 40% tax payer I get this paid into the pension working on the principle that some day when I retire I will structure my finances so that I am a 20% (or whatever the appropriate lower tax rate is by then) taxpayer on the money that comes out of my pension. With I fair wind I might not even be in the UK having taken my pension elsewhere using the QROPS process. Of course most of you knew this as I had detailed this and more here.
Friday 20 August 2010
The Boom Continues – Australian Property Market – August 2010 Update


Wednesday 18 August 2010
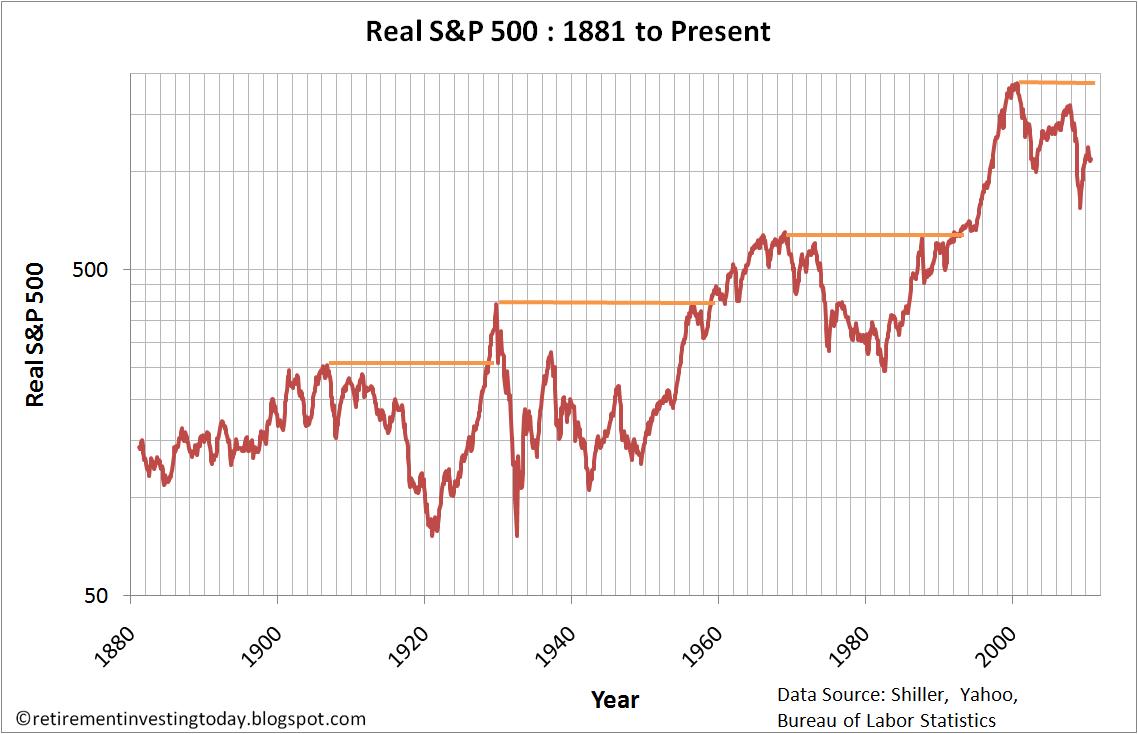
The Lost Decade – History of Severe Real S&P 500 Stock Bear Markets – August 2010 Update

Subscribe to:
Posts (Atom)