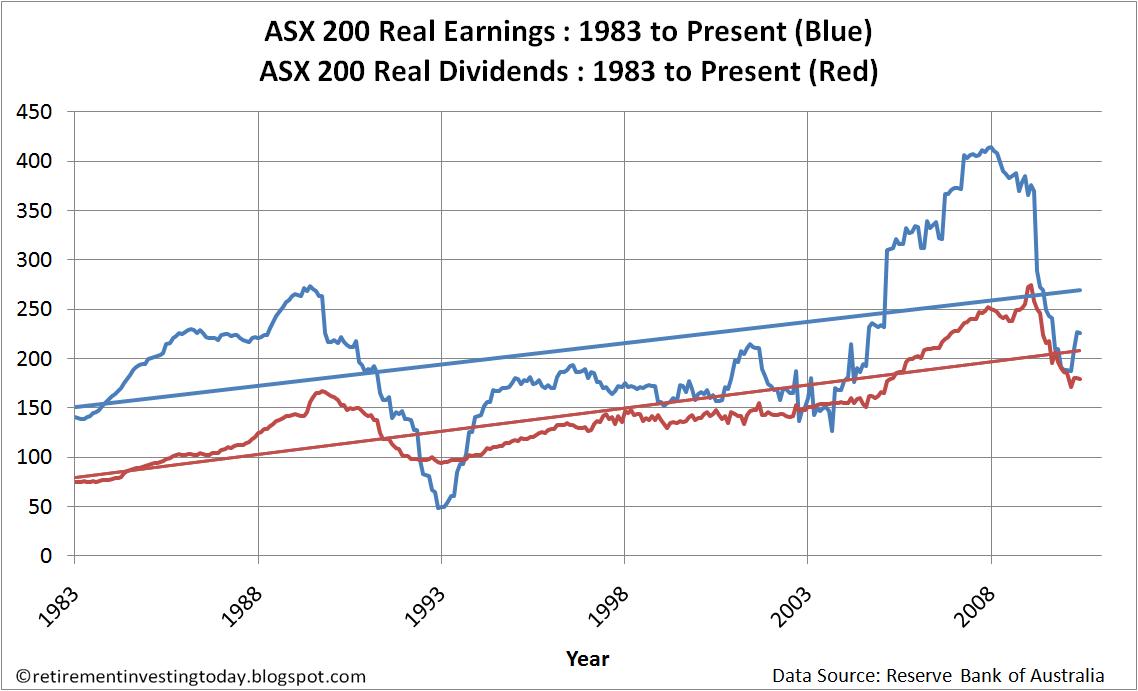
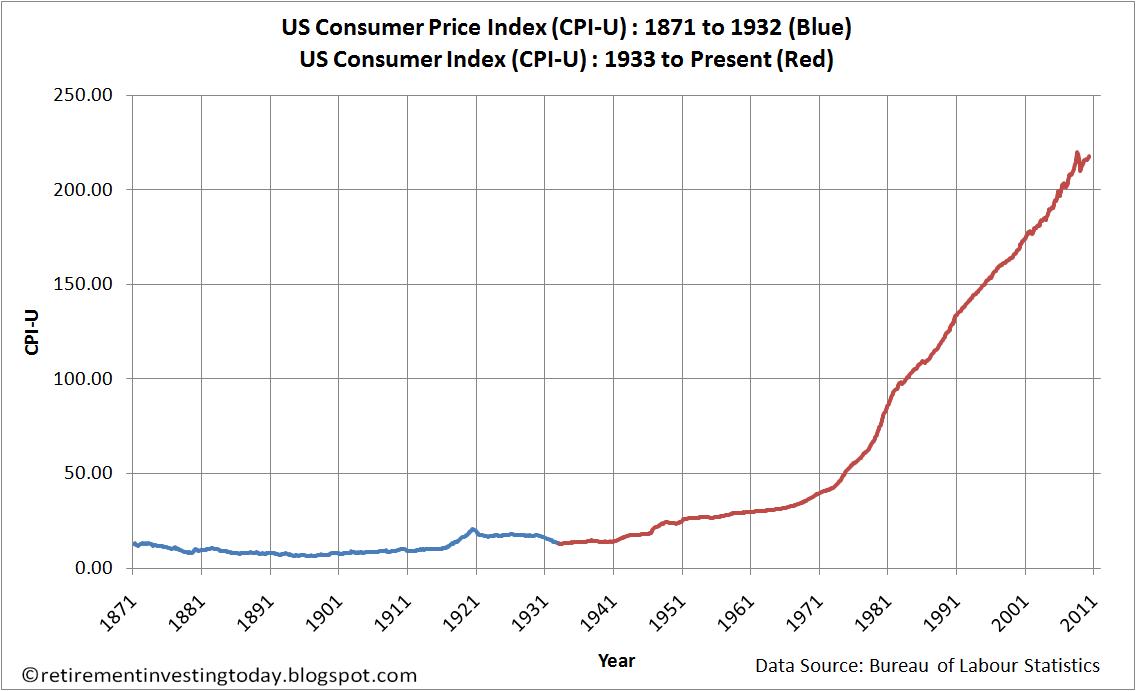
To try and squeeze some more performance out of a retirement investing strategy that is heavily focused on asset allocation I am using a cyclically adjusted PE ratio (known as the PE10 or CAPE) for the ASX 200 to attempt to value the Australian Stock Market. The method used is based on that developed by Yale Professor Robert Shiller for the S&P 500. I will call it the ASX 200 PE10 and it is the ratio of Real (ie after inflation) Monthly Prices and the 10 Year Real (ie after inflation) Average Earnings. For my Australian Equities I will use a nominal ASX 200 PE10 value of 16 to equate to when I hold 21% Australian Equities. On a linear scale I will target 30% less stocks when the ASX 200 PE10 = 26 and will own 30% more stocks when the ASX 200 PE10 = 6.