Monday 28 October 2013

Responding to Risk with Intelligent Analytics

By Joe Budden

Following the financial crisis of 2007-2008, many veteran traders were faced with a totally different financial landscape in which to operate. The ‘New Normal’, a term first coined by Pimco trader, Mohammed El-Erian, became the finance community’s go-to word for a new world order which bore more similarities with the post Depression era than anything investors had previously experienced.

This ‘New Normal’, characterised by persistently sluggish growth, high unemployment and political wranglings over debt ceilings and budget deficits, is now five years on and shows no sign of abating.
But it is not only political parties that stand to lose from this new period of economic stagnation.
Financial markets, as a result of huge injections of artificial liquidity from central banks, now reside atop a mountain of debt and are precariously placed should we see any reduction in liquidity or future drop in growth.

Indeed, it could be argued that the super loose monetary policy used in response to the biggest recession since the 1930’s has actually heightened risk, and the resultant artificial rally in global stock markets has created a world in which markets are now scarily dependent on the money flows from central banks.

Much like an addict becomes dependent upon a drug, the financial markets have become dependent on the monthly injections of quantitative easing from the Federal Reserve, and it is for this reason that every FOMC meeting is now watched with baited breath by most traders.
And just like the symptoms of withdrawal when such a drug is taken away, the potential for significant market volatility is profound and something that every investor and trader should be prepared for.

The next shock to the system: Inflation

At the heart of the problem financial markets face is a battle between stagnant economic growth and the coming onslaught of inflation, brought on by years of easy money. Normally this would not present too much of a problem since periods of economic stagnation can be easily prodded into life by central bank intervention.

However, to believe this is to forget that the central banks have now used up all of their bullets. Indeed, central banks now sit on a mountain of debt with no alternative but to scale back, or ‘taper’ as the Fed like to call it - rhetoric that has already caused significant turmoil in stock markets over the last couple of months.

And with the prospect of future unwinding, the already fragile growth picture seen in most developed nations, has the potential to stall even further. (Indeed, recessions typically occur every 4-6 years in developed countries meaning we are now overdue.)

Wednesday 23 October 2013

A Method to Help Us All Save More

The road to wealth creation, which leads to financial independence if persisted with, is no secret.  In fact P. T. Barnum in his 1880 publication, The Art of Money Getting (available for free in Kindle Edition at the link), which is still as relevant today as when it was first published, reveals it by the second paragraph.  “Those who really desire to attain an independence, have only to set their minds upon it, and adopt the proper means, as they do in regard to any other object which they wish to accomplish, and the thing is easily done.  But however easy it may be found to make money, I have no doubt many of my hearers will agree it is the most difficult thing in the world to keep it.  The road to wealth is, as Dr Franklin truly says, “as plain as the road to the mill.”  It consists simply in expending less than we earn; that seems to be a very simply problem.  Mr Micawber, one of those happy creations of the genial Dickens, puts the case in a strong light when he says that to have an annual income of twenty pounds per annum, and spend twenty ponds and sixpence, is to be the most miserable of men; whereas to have an income of only twenty pounds, and spend but nineteen pounds and sixpence is to be the happiest of mortals.”

If “those who really desire to attain an independence, have only to set their minds upon it” and spend less than we earn I ask how do we find ourselves in a world some 133 years later where every 5 minutes and 7 seconds someone is declared insolvent or bankrupt and the average household debt in the UK (excluding mortgages) is £6,020?  Why is it “the most difficult thing in the world to keep it”?  While we shouldn't trivialise this as there likely many reasons depending on who you are, which includes some people who through no fault of their own fall on hard times, I also can’t help think of two major reasons which likely prevent the road to wealth from being found for many.  The first is that in the modern day a lot of people refuse to take responsibility for their own actions but instead prefer to act like a victim.  The second is education.

If nobody shows you where that needle in the haystack is then probability says you won’t find it.  The problem is in modern society who has it in their interest to show you where the needle is?  Of course the individual does but if they never know they are looking for it then it’s down to luck to stumble across it.  Family and friends possibly do but it relies on them having found the needle for themselves.  Worse it is actually in the rest of the world’s interest for you not to find the needle.  All those advertisements you are bombarded with day and night whether direct or more subtly via the current lazy mainstream media certainly don’t want you to discover it.  They want you spending “twenty pounds and sixpence” and not “nineteen pounds and sixpence”.

Let’s therefore make this post a needle in the internet haystack and hope that some find it.  If you’re reading this then feel free to Like or Tweet it, as every one of those places another needle in the haystack that might be found.  Let’s detail the simple method that helps me save more.

Step 1: Prepare a Budget

A budget is no secret and I’m sure 99.9% of the population is already aware of what a budget is.  Just about every personal financial site and book talks about them.  While well known they unfortunately don’t give you any answers but they do give you information.  They won’t help you save more but are a necessary first step as they:

  • let you take a step back to see what the situation looks like;
  • tell you how quickly you need to act; and
  • tell where you should focus first.


If your budget shows you spending “twenty pounds and sixpence” then you clearly have an emergency on your hands.  Every second that passes is seeing you move further into debt which is then making it more difficult to ever get out of it.  Mr Money Mustache ‘eloquently’ advises that in this situation the correct response is to treat it like “there is a cloud of killer bees covering every square inch of my body and stinging me constantly!!!!  I need to stop it before I am killed!!!”  In this situation you need to get yourself to the point of only spending “nineteen pounds and sixpence” quickly.

Saturday 19 October 2013

No Record High for UK House Prices, says RIT

UK house prices rose to a new high in August, according to the Office for National Statistics (ONS)” reports the BBC.  “House prices in August were 3.8 per cent higher than the previous year at £247,000 - topping the previous all-time high recorded in January 2008, according to the Office for National Statistics” reports The Telegraph.  “Average house prices in the UK leapt to a record high of almost £250,000 during the summer” reports The Times.  Sometimes I really do despair.  Is there no decent journalism left in this great country of ours?  Before we even get into this posts content let’s be clear.  A new house price high has not been hit.  The last high was back in 2007 and we are nowhere near that today.  Let’s now run the numbers to prove it.

Firstly it’s important to understand that there are a multitude of UK House Price Indices out there with every one of them measuring something different.  I track five of them:

  • The Rightmove House Price Index.  It calculates its house price by simply taking the Arithmetic Mean or Average asking price of properties as they come onto the market.  This means it will be affected by price changes, if the mix of house type changes and if the mix of location changes for houses coming onto the market.  It is not seasonally adjusted and covers properties from England and Wales.  So this index really doesn’t track house prices as no purchase is required for it to appear within the index making it pretty much worthless.  I only use it as a possible leading indicator (see below).
  • The Acadametrics House Price Index.  This index uses the Land Registry dataset but in a different way.  It calculates its house price by taking the Arithmetic Mean or Average of bought prices.  It then mix adjusts the data to take a constant proportion of property types, from a constant mix of geographic areas.  It is seasonally adjusted and covers properties from England and Wales.  It covers buyers using both cash and mortgages.  
  • The Halifax House Price Index.  This index is based on buying prices of houses where loan approvals are agreed by Halifax Bank of Scotland.  It uses hedonic regression to remove type and mix variations thereby measuring the price of a standardised house.  I use the non seasonally adjusted dataset and it covers the complete United Kingdom.  
  • The Nationwide House Price Index.  This index is very similar to that of the Halifax except it is based on buying prices of houses where loan approvals are agreed by Nationwide.  
  • The Land Registry House Price Index.  This index uses repeat sales regression on houses which have been sold more than once to calculate an increase or decrease.  As it analyses each house and compares the latest buying price to the previous buying price it is by definition mix adjusting its data also.  This is then combined with a Geometric Mean price which was taken in April 2000 to calculate the index.  It is seasonally adjusted and covers properties from England and Wales.  It covers buyers using both cash and mortgages.  


To use these indices we must also remember there is a timing shift between the indices.  Firstly, a house is placed on the market for the first time (the Rightmove Index).  Secondly, somebody possibly buys the house using a mortgage (the Nationwide and Halifax Index).  Finally, the purchase is registered with the Land Registry (the Land Registry and Academetrics).  The best estimate of this timing shift is shown in the chart within the paper by Robert Wood entitled A Comparison of UK Residential House Price Indices.

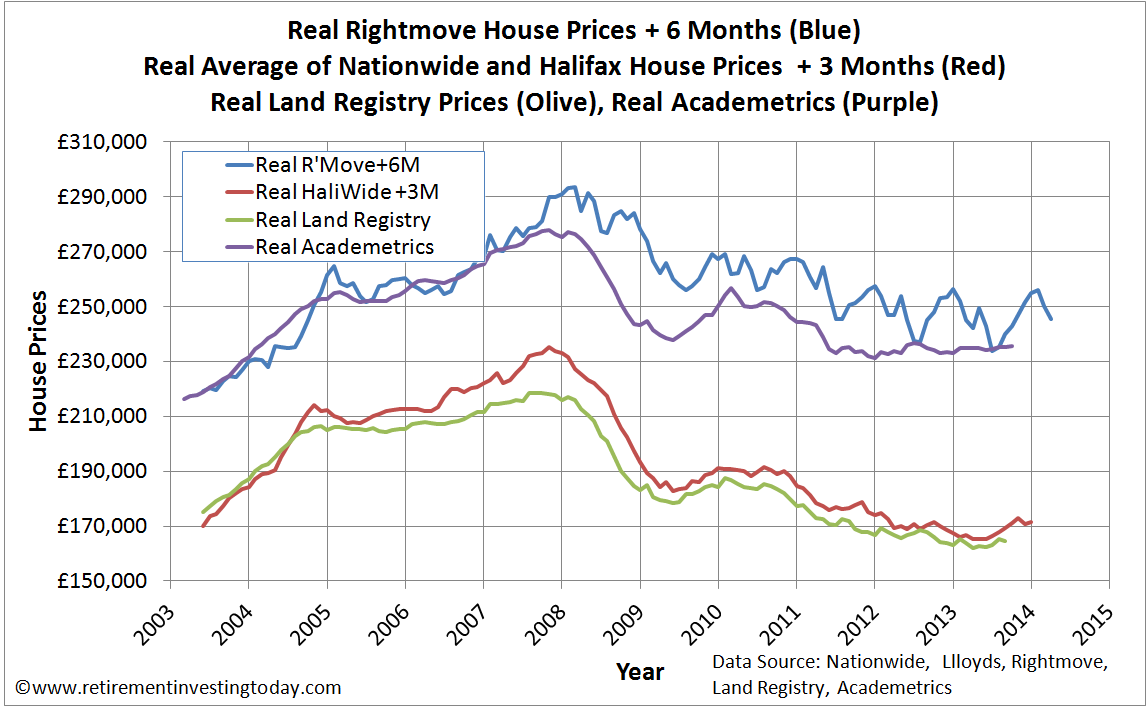
Let’s apply this timing shift, place all of the indices onto a chart and look at what we have.

House Prices according to Rightmove, Nationwide, Halifax, Land Registry and Academetrics
Click to enlarge  

The Nationwide, Halifax and Academetrics, while showing a recent uptick, are all nowhere near record highs.  The Rightmove Index suggests a record high was reached in August and Academetrics shows we have just seen one.  The argument is flawed though because all of these indices are measured in a currency which is being continually devalued through inflation and so is not a constant.  Let’s therefore correct for that and have another look.

Real House Prices according to Rightmove, Nationwide, Halifax, Land Registry and Academetrics
Click to enlarge  

That looks pretty compelling to me.  UK House Prices are nowhere near a new high.

Tuesday 15 October 2013

Using a Credit Card to Save Hard (+ UK Average Weekly Earnings)

The Office for National Statistics reports that the Average (Gross, before tax) Weekly Earnings of those that choose to work in this great country of ours is rising by 0.6% per annum.  David Cameron might even spin this into a demonstration that Strivers are starting to get ahead but we have plenty of more work to do if we are to lock in the recovery.  Of course nothing is further from the truth as while that increase has taken place our “strivers” purchasing power has been reduced by 3.1% through inflation (RPI).  This means that on the average all those “strivers” out there have actually taken a gross pay cut of 2.5%.

This is not a new phenomenon.  Real (post inflation)Gross Earnings have been falling for a number of years now.  This can be seen in the chart below which takes the average weekly earnings, multiplies these earnings by 52 weeks to get an annual figure and then corrects for currency devaluation caused by inflation.

Index of UK Whole Economy Average Weekly Earnings Corrected for the Retail Prices Index (RPI)
Click to enlarge

If you’re a “striver” you’re probably thinking this all looks a little bad but it’s actually worse than this.  We all know our politicians continually like to make promises they (we?) can’t afford and love to waste our money on pet follies but don’t like to tell us what that all really costs.  So to hide some of the cost they use that inflation to their advantage by combining it with our Progressive Tax system and Fiscal Drag to tax us more without having to even tell us.

Let’s demonstrate with an example.  Our average “striver” was earning a gross £471 per week and was then given that 0.6% annual increase taking his earnings to £474 per week.  Using a PAYE Tax Calculator we can see our “striver” has seen his net (after tax and national insurance) earnings rise from £374.47 to £376.51.  So as far as the “striver” is concerned it’s not an increase of 0.6% at all but actually 0.5%.  After correcting for inflation the pay cut is then actually 2.6%.

Sunday 13 October 2013

A Retirement Investing Today Review 9 Months into 2013

This is the regular quarterly feature that demonstrates the progress a person living the tools and techniques that this site details can make towards early financial independence.  It is important to note that unlike many books or other websites out there this feature is not a simulation or model.  It is my life so you can say I have plenty of skin in the game and a big incentive to get it right.

This site is all about Save Hard, Invest Wisely, Retire Early so as with the 2012 Review let’s continue to use those 6 words as a theme.

SAVE HARD

I am now into a sixth year of aiming to save 60% of my earnings, which I define as my gross (ie before tax) earnings plus any employee pension contributions.  The game is all about finding ways to Earn More and Spend Less with the difference between the two being the Save Hard that can be put to work within my investment portfolio.

During my first few years it was all about getting to that 60% savings rate but having achieved it the real challenge now is to stay there.  It really is starting to become difficult to maintain that savings position.  The main reason for this is that I measure my savings rate against gross income and I'm a 40% taxpayer.  This means that if I get a pay rise to even partially compensate for inflation I have to save all of it to keep to the 60% savings rate.  This is because of the stealth tax practised in this country known as fiscal drag which doesn't up rate tax brackets with inflation.  I therefore have to continually find ways to offset 100% of the inevitable inflation in my spending which given the current economic climate I'm sure you will agree is difficult.  Let me give just 2 simple examples, which I’ll likely expand on in subsequent posts:

  • This week we've had the announcement that SSE is to raise gas and electricity prices by 8.2%.  Last year I only used my central heating for about 4 hours so I have already minimised the elephant in the room for most people.  On top of that I still need to cook meals as it’s cheaper than eating out plus have the lights on when it’s dark but already use energy efficient bulbs (and only have the light on in the room that I am using).  Where do I go next?  Note I have a vested interest here as energy price rises hurt me but I own SSE in my HYP so I also want them to maximise profits.
  • To maximise both my better half and my savings I choose to commute a long distance to work which means I burn quite a lot of fuel and we all know fuel prices are rising.  I'm already using a fuel efficient car and always ensure tyres are correctly inflated, I'm carrying no excess weight plus have developed a very light right foot combined with the ability to coast rather than brake.  Where do I go next?  Here I actually have some ideas.  They seem to be working but I want to ensure they are sustainable before I post about them.  


Year to date my savings rate is still above target at 61%.  This might sound like I'm meeting target but I see trouble ahead given that in quarter 1 the rate was 67% and in half 1 it had slipped to 64%.  The problems are all coming from my good friends HMRC.  As I detailed 3 months ago HMRC made a large mistake which resulted in an underpayment of tax which they are now collecting but having now just lodged my tax Self Assessment I can see there is further trouble ahead.  This is coming from the fact that my net wealth is now a not inconsiderable sum with 32% of it not being tax efficiently invested (not in a SIPP, ISA or NS&I Index Linked Savings Certificate).  This means my annual tax bill on those investments is also now not inconsiderable.  By the time the underpayment is recovered and I've paid tax on those investments I can easily see my savings rate falling into the low 50%’s by year end.

Saving hard 9 months in score: Conceded Pass. Ok for now but definite trouble ahead.