Saturday 31 December 2016

2016 HYP Review

My mature overall investing strategy is these days not much more complicated than a diversified collection of low expense, physical (as opposed to synthetic), income based (as opposed to accumulation) ETFs tracking enough indices to give me diversification across asset classes and countries held within low expense wrappers.  While this is where my journey has left me, as the best strategy for me, I’ve tried a number of different things over the years that I’m either neutral on or negative to.

A negative, for example, are actively managed investment funds.  As I’m negative on them I’ve done everything I can to move my investments away from them but even so I still have a couple that I can’t sell for tax reasons.  A neutral is my UK High Yield Portfolio (HYP) which because I’m neutral on it now just sits passively amongst my portfolio doing its thing.  It’s just completed its 5th calendar year and still contains a not insignificant £65,000 or so of my hard earned wealth.

Its original aim was to help me live off dividends only in FIRE and in that regard it’s still punching above its weight as it’s now only 6% of my total wealth but spins off 16% of my dividends.

My neutral approach mean changes to the HYP are now few and far between with changes for now only being forced by corporate events.  In 2016 there was only one of these:

Saturday 17 December 2016

I’ve written and published that book

Over my 9-year journey to financial independence (FI) I’ve had a number of readers of both this blog and the fora that I frequent ask me if I’d write a book.  If the truth be told I was reticent while on my journey as I thought I would be a hypocrite for writing about how to achieve something that I actually hadn’t done myself.  That all changed in July 2016 when I achieved my financial independence goal with being a hypocrite switching to feeling empowered and ‘qualified’ to tell the story.

I also thought that I was too busy to write the book but in hindsight that was just the victim coming out in me.  Like anything in life both achievement and success is all about unrelenting prioritisation in my experience.  Without that you just don’t have a chance.  So with a focus on just work and the book (thanks go out publically to a very understanding and supportive family who’ve had to put up with it and me) I’ve been able to get it written over the past months and it’s now published.

I’ve called the book - From Zero to Financial Independence in less than 10 Years: Tools and techniques to escape the rat race quickly.  It’s currently only available on Amazon but is available in both ebook and paperback formats giving some choice.

So why write it?  A few reasons:
  • I’ve found my FI journey an incredible experience both financially and spiritually.  I’ve also learnt so much, including a lot about myself, most of which will serve me well for life.  This includes a switch to focusing on quality of life rather than the far more common standard of living.  At age 44 I am also now in a position that is incredibly liberating and empowering.  I would just love others to be able to at least see what’s possible and hope the book might spread that message further than this blog.  If they then choose to stay on their current course I’m more than ok as at least they saw an alternate option and made a choice.  The book has only been live a few days and this goal is looking good so far.  It is already ranked number 4 in their retirement planning category, number 11 in their ebook personal finance category and number 24 in their ebook finance category.
  • I wanted to provide the book that readers asked for.
  • An unexpected reason was that I actually found the whole process incredibly cathartic.  For years I have been learning and had tonnes of information swirling in my thoughts.  By sitting down and putting pen to paper it allowed all that to be organised and filed forever freeing my thoughts for more.

Saturday 10 December 2016

Pushing pensions to the limit

I continue to find pension wrappers are a powerful tool for building FIRE wealth quickly.  Let me demonstrate with a couple of quick examples:
  • Over my FIRE journey I am fortunate to have found ways to earn more which means that I am today a 45% additional rate tax payer.  On top of that I also have to pay 2% employee national insurance on the last of my earnings.  This means that if I earn £10 and I don’t salary sacrifice it into a pension wrapper I only end up with £5.30 to invest.
  • My employer allows pension salary sacrifice, has a contribution match up to a certain percentage and also gives me 10% of the 13.8% employer National Insurance that they save when I contribute to the company pension.  So under these conditions if I put that same £10 into the company pension I actually end up with £21 to invest.  That’s nearly 4 times more.
  • Even if I continue to contribute to the pension wrapper once the employer match is over its still favourable.  In that instance I still end up with £11 going into the pension which is more than 2 times the savings outside of the pension.

The wise among you will now being saying ‘but pensions are just a tax deferral scheme’ and that’s certainly true but let’s look at how that will play out in FIRE.  The UK in my view can almost be considered a tax haven for those with enough wealth that work is not required.  To demonstrate let’s take £20,000 from that pension pot every year.  The 25% pension tax free lump sum effectively gives one £5,000 tax free.  Then one also gets a 0% tax rate from the £11,000 Personal Allowance leaving just £4,000 subject to 20% Basic Rate tax.  That works out to be an effective rate of tax on the £20,000 of just 4.0%.

Move to the Mediterranean and it could be even more favourable.  Cyprus, for example, gives a choice of how pensions can be taxed.  The first is 0% tax until you earn EUR19,500 with the next band being 20%.  In this example our £20,000 (assumed to be EUR22,460) sees an effective tax rate of just 2.6%!  The other method favours high pension sums as the income is taxed at the flat rate of 5% on amounts over EUR3,420.  In this example one’s effective tax rate would be 4.2% so one would pick the former in this example.

Saturday 12 November 2016

Where’s the snowball – why you’d better save if you want to FIRE

You don’t have to travel far into most personal finance sites before you find the obligatory compound interest post.  Even I did one back in 2012 where I was so bold as to call it The Miracle of Compound Interest.

In brief Compound Interest, sometimes also called the snowball effect, is at its most basic just interest on interest.  A trivial example.  Let’s say you have £1 and can get an investment return of 10% per annum (those were the days).  Choose that option and after a year you’d have £1.10 which is your £1 plus ‘interest’ of £0.10.  If you reinvest that for another year you’d have £1.21 which is your £1, last years interest of £0.10, this years interest of £0.10 on your £1 but also £0.01 which is interest on your £0.10 interest from last year.  Interest on interest...

So that’s the lovely theory but as someone who is now Financially Independent and so has been there, done that, got the t-shirt, what’s my view on it.  I’d now say care is needed.  Let me demonstrate with three simple examples.  Let’s go back in time to the end of 2007 where I’m going to give each of our punters seed capital of £50,000, I’m going to assume a real (after inflation) return of 4.1% (what I’ve achieved on my portfolio of trackers after expenses) and I’m going to assume their each looking for wealth of £800,000 (which is not far off what I thought I needed back then although inflation since has ensured I now need 2 commas) before packing in the day job.  From here their journeys will vary:
  • TheRIT will crack on with working hard, focus on quality of life and so annually squirrel away £58,728 per annum (which is the average annual savings I’ve achieved since I’ve been on my FIRE journey, equating to a post tax Savings Rate of 82.4%) earning a real return of 4.1% per annum (my actual real annualised return thus far).  I know that will include inflation adjusted savings but please give me a little slack here as it’s not important to the point I’m trying to make today so won’t bother with inflation adjusting.
  • MrAverage will also crack on with working hard but instead focuses on standard of living.  This means he can only save 5.1% of post tax earnings which has been deliberately chosen as it’s the current UK household saving ratio according to the ONS.  Like TheRIT, MrAverage achieves a real return of 4.1%.
  • MissInvestingSuperstar follows in the footsteps of MrAverage but boy does she know her stuff when it comes to picking winners.  So much so that every year that she invests she manages double the return of the others and so achieves a real 8.2% per annum.  Ask yourself how many people actually achieve that and would you be prepared to back yourself to achieve that with severe disappointment many years hence if you don’t?
My after tax Savings Rate over the long term has been 82.4%
Click to enlarge, My after tax Savings Rate over the long term has been 82.4% 

Saturday 29 October 2016

Herefordshire or bust?

In recent times some focus in the RIT household has now switched from A Place in the Sun to what about Herefordshire?  As with any of our crazy ideas our approach is always plenty of desk research and then boots on the ground.  All I can say is that Herefordshire is everything we remember from previous visits.  An absolutely beautiful part of the world but then again at this time of year in the UK, with the leaves yellow to red and starting to fall, ugly parts are probably the exception so some care is needed.

Click to enlarge, Kingsland, Herefordshire (source)

Of course our trips have not been all about roaming around country paths, lanes and villages  although we’ve done some of that.  They’ve also initially focused on looking at the possibility of building a modest warm home.  Don’t get me wrong, we love an old historic grade II listed home like the next man or woman, but as a FIRE’ee we don’t very much like the energy performance or maintenance costs that go with them.

Sunday 16 October 2016

9 months into 2016 – The plans they are a-changin’

Cyprus vs The English CountrysideWith the back of 2016 now largely broken this year is fast shaping up as one of the most memorable of my FIRE journey thus far.  Personal finance wise it’s been great.  My wealth passed 7 figures, I became financially independent (FI) and the rate of change in my wealth has been like nothing I’ve ever seen before or could have imagined when I started on this journey.  To put that last point into perspective by the end of quarter 1 I had added £55,000 to my wealth, by the half year mark that had become £142,000 and by the end of quarter 3 it had become an almost unbelievable £220,000.

However, this is not what is making things memorable.  That’s coming from me slowly realising that because my FIRE strategy makes me an outlier it also makes me vulnerable and exposed rather than invincible.  This was nicely demonstrated by the Brexit vote.  As a ‘young’ retiree looking to head to The Mediterranean within a year I’m sure it doesn’t take a genius to guess that I voted Remain in the Brexit referendum.  If everyone else had have been on my trajectory that would have been the result.  Instead my demographic had no influence, as the numbers of people looking to FIRE to The Med are probably not much more than one, so democracy took over and we ended up with Leave for many other reasons.  So far that result has resulted in pound devaluation (which on its own I could have coped with) but also discussions of Hard Brexit which has turned my plans from 95% The Med to 50%.  I’m a minority affected by politics and populism and because I’m not part of a significant demographic my vote just won’t make a difference.  What if the next populist democratic step is to start taxing capital and providing relief to the indebted...  We’re almost there via interest rates anyway but what if it becomes an overt policy...

Saturday 8 October 2016

Post financial independence, post Brexit, what next

FIRE in Cyprus?
There are now literally hundreds of personal finance bloggers out there in cyberspace with many of them blogging about trying to reach financial independence.  Some are more extreme than others but I have now started to see a distinct pattern that separates them into at least two categories.  The first are those where reaching financial independence in just a few short years was a doddle and where life since early retirement has been a bed of roses with low spending, plenty of international travel, new cars, new homes and nothing ever going wrong.  Then there are those where stuff, including negative stuff, happens.  The journey to FIRE maybe takes determination, maybe their company gets bought out with redundancy coming relatively soon after, maybe their company simply doesn’t agree with their lifestyle choices causing a rethink or just maybe early retirement was not for them so they have returned to work.

I’ve started to call the first the blogs that are selling a life and the second the blogs that are living a life.  I’ve also pretty much stopped reading the former as they no longer resonate with me as my journey has and continues to be much more like the second type.  If you however prefer the first type then I’d suggest you move onto your next piece of Saturday reading as this post will likely disappoint.

I’m now coming up on 3 months of financial independence (FI) and the one thing I’ve been trying to leave via FIRE (financially independent retired early), work, has already become a very different place.  My workplace and the career I chose is one that is very focused on the financial top and bottom lines.  This means that it’s no secret that as soon as my job can be done by somebody else cheaper or more efficiently in the world then I won’t have a job.  It’s also one where if you perform well you can do well financially, and I have, but also one where even average performance will result in you quickly finding yourself without a job.  For me this has helped with my rapid progress to FI (of course it’s taken a number of other choices as well) but it’s come with the sword of Damocles always in full view.  3 months ago that sword was taken away and it’s made a big difference.  It’s firstly just simply removed a weight from my shoulders as out sourcing or average performance will now just result in a nice pay off, which I negotiated some time ago when I seriously looked to move on but was still a golden child, which will further bolster my wealth nicely and result in me simply sailing off into the FIRE sunshine.  Additionally, to ensure continuous success one technique I’ve used over the years is to work very hard which gives me extra time to drive the risk out of every decision I make.  The ramifications of this are pretty long days but it did help with surety of tenure.  Since FI I’ve started to take now take more risk as there are now no downsides personally.  So far this has me back to peak performance, having dipped for a few months following extra work load, but I’m also working slightly less hours and that 0.5 – 1 hour less work per day has put a spring back in my step.  It’s still not the place I’d choose to be Monday to Friday and FIRE is still very much in view but it’s a lot better post FI then pre.

Saturday 24 September 2016

Checking my credit report (and it’s not great news)

From the fortunate position I currently find myself it’s unlikely I’ll ever need or want to take on any form of debt ever again.  That said I’m also a plan for the worst just in case kind of guy. Incidentally, the end result of which is usually a nice upside surprise but you just never know.

So with this in mind I decided to finally, having never checked it previously, check in on my credit report and score.  I used noddle.co.uk as its ‘free for life’ but there are a few of them out there including Experian and Equifax who offer free 30 day trials.  Just don’t forget to unsubscribe with those or you could be paying up to £14.99 per month for every month you forget.  Not an insignificant amount.

If I’m being honest I was expecting a nice credit worthiness upside and the actual result surprised me somewhat.  So let’s look at what they have on me:
  • Personal Information.  They have my date of birth and history of addresses.
  • Financial Account Information.  They have my American Express Platinum Cashback credit card which shows a long and perfect history of repayment as I direct debit full payment every month.  They show my current account but have no record of my cash savings accounts.  Unfortunately they also show a store card with a missed payment of £4 which is not even mine.  I’ve disputed that which they say can take 28 days to resolve.  So checking my credit report has already been of value.
  • Short Term Loans.  I positively get “YOU HAVE NO OPEN SHORT TERM LOAN ACCOUNTS ON YOUR REPORT.”
  • Electoral Roll.  I’m showed as being registered and the details are correct.
  • Public Information.  I positively get “YOU HAVE NO BANKRUPTCIES OR INSOLVENCIES RECORDED ON YOUR REPORT” and “YOU HAVE NO JUDGEMENTS RECORDED ON YOUR REPORT.”
  • CIFAS (the UK’s Fraud Prevention Service).  I positively get “THERE ARE NO CIFAS WARNINGS REGISTERED AT YOUR ADDRESS(ES).”  

Saturday 10 September 2016

Rearranging my YouInvest SIPP

I have had a YouInvest (formerly Sippdeal) SIPP (Self Invested Personal Pension) wrapper since 2011.  It came about when I first started transferring expensive insurance company based Stakeholder and Group Personal Pensions across to SIPP’s to save on expenses.  Over the years this SIPP has grown steadily to become a significant portion of my wealth as it now contains circa £200,000.

Within the YouInvest SIPP I was holding the following three investment products:
  • The Vanguard FTSE U.K. All Share Index Unit Trust with annual expenses of 0.08%;
  • The Vanguard U.K. Inflation-Linked Gilt Index Fund with annual expenses of 0.15%; and
  • The iShares European Property Yield UCITS (IPRP) with annual expenses of 0.4%.

For the privilege of using the YouInvest SIPP wrapper I was also paying annual expenses of £300 which was coming in the form of:
  • A YouInvest SIPP custody charge of £25 per quarter as my SIPP value was greater than £20,000; and
  • A YouInvest Funds (Unit trusts and OEICs) charge of 0.2% per annum but which was capped at a maximum of £50 per quarter

Life was good and even though I didn’t like paying the £300 per annum I didn’t do anything about it as to correct it I would have had to be out of the market and might lose significantly more than I gained.  That was until I received a notification from YouInvest in early August 2016 that they were intending to change their charging structure from the 01 October 2016 which included a great reason [sic] for the change – “We believe this will be easier to understand, whilst maintaining AJ Bell’s commitment to offering some of the lowest charges in the market.”

Saturday 3 September 2016

Can you afford to not DIY invest

Grant Thornton has completed some research (free FT link or Google “How much do you really pay your money manager?”) which concludes that someone entrusting £100,000 for 10 years to a UK financial adviser or investment manager would pay an average 2.56% annually for financial planning services and financial product expenses.  Let’s look at what that might mean during both the wealth accumulation and drawdown (assuming no annuity is purchased) phases of a typical investor.

Wealth accumulation phase

When it comes to investment return, excluding expenses, I believe that active investing is a zero sum game resulting in average performance no better than that of the market average.  Of course there will be some winners and some losers, particularly in the short term, but that’s for another day.  Today let’s therefore assume that the investment return these money managers achieve is that of the market.  Let’s look at a couple of possible portfolios.

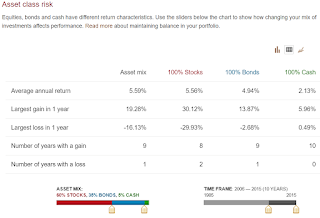
Unfortunately, the Vanguard LifeStrategy funds have only been around 5 years or so which isn’t enough time to use for this study as I need 10 years (or so) of data.  Vanguard does however have an interesting Asset class risk tool (h/t diy investor (uk))which allows you to input a period and an asset allocation.  Let’s create a reasonably balanced portfolio with 60% stocks, 35% bonds and 5% cash and run for a period of 10 years.

10 year time frame, 60% stocks (FTSE UK All Share Total Return Index), 35% bonds (FTSE British Govt. Fixed All Stocks Total Return Index (1983 - 2013) and BarCap Sterling Aggregate Total Return Index), 5% cash (LIBOR 3-month average over the year)
Click to enlarge, 10 year time frame, 60% stocks (FTSE UK All Share Total Return Index), 35% bonds (FTSE British Govt. Fixed All Stocks Total Return Index (1983 - 2013) and BarCap Sterling Aggregate Total Return Index), 5% cash (LIBOR 3-month average over the year)

The result is an average annual investment return of 5.59%.  So with this return what does our investor have left after a few subtractions.  Firstly, let’s subtract the erosion caused by inflation.  The RPI has averaged 2.87% over the last 10 years.  Subtracting that gives us a real return of 2.72%.  Now let our money manager and the investment products s/he is peddling take their cut of 2.56%.  Oops our real return is now 0.16%.  Looking at it another way our average money manager/investment product provider is taking 94% of our real return, leaving us with 6% only, which is hardly conducive to long term wealth building.  It also gets worse as that will be before portfolio turnover costs, taxes and trading costs to name but three.  After those we’ve probably nearly done no better, or maybe even worse, than matching inflation which might mean we’re actually even going backwards.

Saturday 27 August 2016

The power of AND

Putting the scores on the doors reveals that I progressed to my Financial Independence number at a rate greater than 0.9% per month.  In hindsight this wasn’t because of any one particular silver bullet but instead was made possible by focusing on the personal finance many, rather than a few, or even the one talked about so often, investment return.  Putting it another way I focused on the personal finance AND.  Mechanically that included earning more and spending less and an appropriate portfolio and minimising taxes and minimising expenses and investment return.  Psychologically that included starting and determination and accepting I’ll make mistakes and never becoming a victim to name a few.

Over the last couple of weeks I think I’ve shown this trait again by maximising pension contributions while also minimising expenses.

I have two low cost SIPP’s (two rather than one is for risk minimisation reasons) in which I buy low cost tracker products.  This is my method of minimising pension wrapper expenses and investment product expenses.  However, even though I have these and they would enable me to defer tax if I invested in them directly I choose not to use this route.  Instead all my contributions enter pension wrappers via my employer’s expensive defined contribution old school insurance company group personal pension.  I do it this way as in addition to deferring tax like I could also do in the SIPP this maximises my contributions in a few more ways:
  • My company does an employer match up to a few percent, which of course I take advantage of, however I also contribute a lot more than this for the two reasons below;
  • My company allows salary sacrifice which means I get an extra 2% contribution into my pension rather than it being lost to employee national insurance contributions;
  • My company adds 10% of the 13.8% employer national insurance contributions that they save if I sacrifice into the pension. 
So I’ve maximised contributions but my employer’s pension scheme then has the big elephant in the room - Expenses.  I try and keep it to a minimum by buying into their tracker funds but even this means I’m paying annual expenses of between 0.6% and 0.87% depending on fund selected.  I can do much better than that in my SIPP’s.  So the trick is to complete a partial transfer into my SIPP when the pot becomes a reasonable size.  The last time I did this it could only be described as a palaver however this time the more appropriate description would be a doddle.

Saturday 13 August 2016

Naive, a victim or just plain irresponsible

Naive (adjective) – (Of a person or action) showing a lack of experience, wisdom, or judgement. Source
Irresponsible (adjective) - not thinking enough or not worrying about the possible results of what you do.  Source

My work day generally does not afford me a lunch break.  It’s generally scoff a sandwich, but not fast enough to give indigestion, between tasks.  A couple of weeks ago after a particularly rough morning I did however break away and joined the ranks of those at the ‘lunch table’ for a few minutes.  This is normally a place of general chit-chat, of what gadgets people are buying, of the latest sports news, of what people are doing on the weekend, but today in the wake of the BHS pension scandal the topic switched to investments, pensions and retirement plans.

When it comes to saving, investing and retirement planning I am very transparent on this blog but in the office I am the definition of a grey man.  After all an environment where your employer knows you have a decent FU stash or are only a few months from FIRE is hardly one where you are going to be able to ramp earnings at a rapid rate.  So I switched on my spidey sense but didn’t dive in with ‘my view’.

Saturday 6 August 2016

The more likely scenario

My financial independence and early retirement (FIRE) planning has been a pretty negative affair so far, with me always trying to focus on the worst case what if scenarios.  I’ve done this as I wanted to have a high confidence that work in the future really would be optional and based on a want to do it and not a need to do it.  With me now over the financial independence line it’s time for me to switch from glass half empty mode to one where the glass is half full.  I’m going to try and answer the question - based on historical data (which of course is not a predictor of the future) what is the more likely outcome for my wealth?  This then enables me to think about what could happen to my spending if I so choose.

I’ve used the cFIREsim tool many times in the past and I’m going to use it again for this analysis.  The negative of it is that it is US based which means if history repeats it will likely be a bit bullish.  The positive is that its data set goes back to 1871 meaning plenty of data points including plenty of bear/bull market cycles but also that it allows you to output data in real inflation adjusted terms which is important as I want to always think of wealth in terms of what can it buy in today’s pounds.

So let’s plug in the data.  Firstly, my financial independence day wealth of £799,000, planned spending of £19,973 (2.5% of wealth),  40 year FIRE period assumption and assumed annual investment expenses of 0.27%.

Now let’s plug in my FIRE financial strategy with one exception.  CFIREsim doesn’t allow you to input REIT’s so I’ll just split my allocation here 50% to Equities and 50% to Bonds.  So that’s 60% Equities, 29% Bonds, 5% Gold and 6% Cash (assuming 0% return on the cash).

Saturday 30 July 2016

Half 1 2016 – What a ride

July has been a month I will never forget.  Firstly, I joined the 2 comma club and then soon after joined the ranks of the financially independent (FI).  In all the excitement what I didn’t do was run my regular quarterly update on my year to date performance.  I’m going to belatedly do that today as I do want a record of my quarterly performance put down on paper (or pixels)

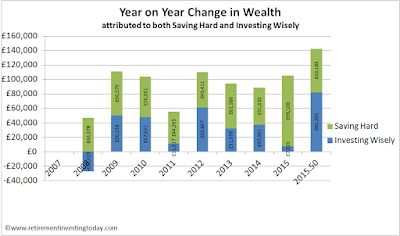
The first quarter of the year started well but the second half was one of the wildest financial rides I think I’ve ever been on.  To put it in pounds, shillings and pence by the end of quarter 1 I had added £55,000 to my wealth but by the half year mark that had leapt to £142,000.  That is more than my savings and investments have produced in any full prior year of my FIRE journey.

RIT Year on Year Change in Wealth (Saving Hard + Investing Wisely)
Click to enlarge, RIT Year on Year Change in Wealth (Saving Hard + Investing Wisely)

With strong contributions from both saving and investing let’s look at the detail.

SAVE HARD

I continue to define Saving Hard differently than most personal finance bloggers.  For me it’s Gross Earnings (ie before taxes, a crucial difference) plus Employee Pension Contributions minus Spending minus Taxes.  Earn more and one is winning.  Spend less or pay less taxes and you’re also winning.  Savings Rate is then Saving Hard divided by Gross Earnings plus Employee Pension Contributions.  To make it a little more conservative Taxes include any taxes on investments but Earnings include no investment returns.  This encourages me to continually look for the most tax efficient investment methods.

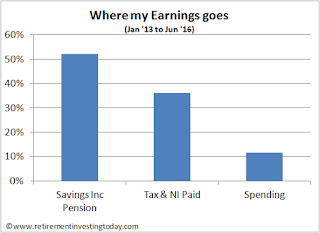
Where my earnings goes
Click to enlarge, Where my earnings goes

That difference is significant and I think best shown graphically.  Measured my way and my Savings Rate since the start of 2013 has been 52.2% but at the same time I only actually spend 11.7% of my earnings.  If I measure it like most in the FIRE community, which substitutes Gross Earnings with Net Earnings, my Savings Rate jumps to 81.7%!

Saturday 23 July 2016

Maximising withdrawal rates in retirement

Wealth warning: This post should at best be taken with a pinch of salt and at worst should be likened to crystal ball gazing.  I’m posting it because this blog is about retirement and particularly early retirement so it is particularly relevant.

If in retirement, including early retirement, we decide to use a strategy that generates an income by drawing down on our wealth, as opposed to say buying an annuity for example, then there are 4 key decisions that we need to make.  They are what withdrawal rate are we going to make (which could be fixed, variable or fixed with an annual inflationary increase to name but three), how much risk (where risk is the likelihood of wealth depletion) are we going to take, what does our asset allocation look like (the equity : bonds ratio) and how many years do we want our wealth to last (the duration).  The aim is to settle on a combination that suits our needs while ensuring we don’t run out of wealth before we run out of life.  The one decision that is unfortunately out of our control is the sequence of returns that Mr Market is about to provide.

The 4% Rule is but one combination of these variables.  Based on historical returns it states that if you settle on a 50% US stocks : 50% US bonds allocation, accept risk that will historically fail 4% of the time and a 30 year time period then you can take a maximum withdrawal rate of 4% of your wealth on day 0 and then increase this by inflation annually.

This post, which for some reason received very little interest from readers but which was highlighted by somebody I respect very much, then shows the historic maximum withdrawal rate available to us for a given asset allocation, risk and duration.

The problem with all of this work is that if history repeats and we are reasonably prudent in selection a withdrawal rate it more than likely results in us leaving wealth on the table (or more inheritance than planned) at the end of the duration.  Historically that is also a very large sum in sum instances.  Take the 4% Rule for example.  Historically it fails 4% of the time which means it succeeds 96% of the time.

Saturday 16 July 2016

That’s it. I’m calling it. It’s my Financial Independence day!


“Financial independence is generally used to describe the state of having sufficient personal wealth to live, without having to work actively for basic necessities. For financially independent people, their assets generate income that is greater than their expenses.” 

3,186 days ago I started on a journey to early Retirement which at the time I defined as work becoming optional.  Only later did I discover that the more appropriate terminology for what I was chasing was FIRE – financially independent and retired early.  Every week since that journey started I’ve sat down and updated my financial position and progress to FIRE.  Today this stared back at me:

Path trodden towards financial independence
Click to enlarge, Path trodden towards financial independence

Yes you’re reading that right.  Today at age 43 I’m officially stating that I am financially independent (FI).  You’d think we’d be out celebrating but in the RIT household this week (and in the run up in recent weeks) there has been calm as I’ve actually been umming and ahing about whether I can actually call myself FI.  The main reason for this is that over the years I’ve diligently planned for just about every financial situation that I can think of however what in hindsight I’ve actually glossed over is the risk of politicians just blatantly changing the rules.  In the past few weeks we’ve seen some of this appear via the Brexit vote which for somebody who intends to emigrate to an EU country as soon as they FIRE has brought real risk.

One of these is the risk that my State Pension might not be triple locked or at least increased with inflation.  Now in my financial planning I’ve never assumed I’d be entitled but I’d always planned on continuing to pay in voluntarily as my insurance policy against financial Armageddon.  Now that insurance policy might be almost worthless as we all know the damage that inflation can inflict.  A second is the risk that at State Pension age I won’t be entitled to the same public healthcare as a local in my new adopted EU country courtesy of UK PLC.  This might mean private healthcare into our dotage but what if we do fall into poor health and our chosen private provider decides we’re no longer profitable enough for them.

At the other end of the scale we’ve seen the government of one of my potential homes, Cyprus, reduce Immovable Property Tax (IPT), which is the equivalent of Council Tax, by 75% in 2016 with a plan to then subsequently abolish it in 2017.  This is a country with so much debt that the Troika stepped in to bail them out only a few short years ago and now they’re cutting taxes by 75% or more.  Sure it plays into my hands for now but it’s not much good if it leads to bust and closed cash points later.

So in light of all of this what right do I actually have to call myself financially independent?  Below is my justification.

Saturday 9 July 2016

Sobering retirement income drawdown demonstrations – 9.5 years in

Unless you’re one of the lucky ones sitting on a defined benefit pension (although it’s likely you’ll also need some other income source in the early years if you’re going to FIRE) or you intend to buy an annuity (again, not likely for the early years of FIRE) or you’re just planning on living off the State Pension then income drawdown in FIRE (or even just plain old retirement) is relevant.

This is the annual update of a series of drawdown demonstrations that are now some 9.5 years in.  To put this in perspective we are now within a whisker of one third of the way through the period that the 4% rule is based upon and this simulation assumes retirement was taken on the 31 December 2006.  If this date sounds convenient then you’re right.  The date was deliberately chosen as it is the year prior to the commencement of the global financial crisis and so hopefully represents a modern worst case.  Someday it may even go down in history as one of the time periods which saw a poor sequence of returns however of course that will only become clear when we are firmly looking in the rear view mirror many years hence.

Over the years readers have suggested various alternatives for these demonstration portfolios however for long term consistency I want to make as few changes to the original assumptions as possible so will stick with them for now.

Where we left our retiree’s last year can be found here.  In brief, the key assumptions are:
  • Our retiree’s are drawing down at the stated withdrawal rate plus fund expenses only.  This means any trading commissions, wrapper fees (eg ISA, SIPP fees), buy/sell spreads and taxes have to be paid out of the earnings taken.  For example, our 2% initial withdrawal rate retiree is actually drawing down at between 2.1% and 2.2% dependent on the asset allocation selected.  
  • 6 Simple UK equity / UK bond portfolios are simulated for our retiree.  The UK equities portion is always the FTSE 100 where the iShares FTSE 100 ETF (ISF) is used as the proxy.  This fund currently carries expenses of 0.07% however this has been as high as 0.4% in the past.  For the bonds portion a simulation is run against UK gilts (FTSE Actuaries Government Securities UK Gilts All Stock Index) where the iShares FTSE UK All Stocks Gilt ETF (IGLT) is used as the proxy and the bond type I have preferred in my own portfolio, UK index linked gilts (Barclays UK Government Inflation-Linked Bond Index), where the iShares Barclays £ Index-Linked Gilts ETF (INXG) is used as the proxy.
  • All calculations are in real (RPI inflation adjusted) terms meaning that a £ in 2006 is equal to a £ today.
  • The wealth accrued at retirement (the 31 December 2006) is £100,000.  To simulate a larger or smaller amount of wealth just multiple by a constant. For example if you want our retiree’s to have £600,000 just multiply all the subsequent pound values by 6.

A 4% Initial Withdrawal Rate

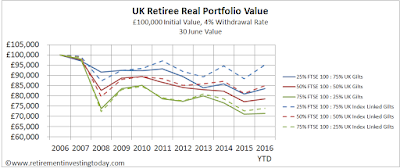
UK Retiree Real Portfolio Value, £100,000 Initial Value, 4% Withdrawal Rate, 30 June Value
UK Retiree Real Portfolio Value, £100,000 Initial Value, 4% Withdrawal Rate, 30 June Value, Click to enlarge

I always start with a 4% withdrawal rate because of the often quoted 4% safe withdrawal rate rule.  The 50% equity : 50% gilts portfolios (the red lines on the chart) are the closest representations to the 4% rule with obvious differences being that:
  • the 4% rule was for a US based investor with US based investments while I’m simulating UK investors with UK based investments; and
  • the 4% rule doesn’t consider fees where I’m capturing the OCF’s of the ETF’s which makes my withdrawal rate very slightly higher.

Saturday 2 July 2016

2 Commas = £1,000,000

Today, as I have done pretty much every Saturday morning since October 2007, I again sat down and updated my wealth and progress to FIRE (financially independent retired early).  This morning was however a little different as when I usually look at the wealth column of my spreadsheet after entering the data I see 6 figures and a single comma.  Today, for the first time, I saw a second comma indicating that my wealth had passed the £1,000,000 mark.

Wealth spreadsheet snapshot
Click to enlarge, Wealth spreadsheet snapshot

This number means I am now 98.9% of the way to FIRE.

RIT path trodden to Financial Independence
Click to enlarge, RIT path trodden to Financial Independence

Retirement Withdrawal Rates vs Probability of Success

The 4% Rule gets bandied around pretty loosely (I sometime think dangerously so) in the personal finance (PF) world these days and on some of the forums people seem to believe in it almost religiously.  What I’m not sure about is if these same people have actually read the T&C’s of the 4% Rule.

Within the T&C’s there are a couple of pertinent points relevant to this post.  Firstly, it is based on US historic data which doesn’t seem to hold for the UK, a global portfolio or for many other countries for that matter and of course history is not necessarily a predictor of the future.  The other point about it is that it gives you a 96% chance of success historically.

Having debated/discussed PF topics and specifically FIRE topics with many of you over the years I’m finally (I can be a bit slow and a bit stubborn at times) starting to realise that I’m a fairly conservative creature and that I also like to go to a level of detail that probably few others would have the patience for.  These traits lead me to selecting FIRE withdrawal rates after expenses of 2.5% that hopefully will give me a 100% chance of success at planned spending even though I know I have the ability in my plans to cut back on discretionary spending in severe bear markets.

Saturday 25 June 2016

Brexit vs FIRE to the Med

So the UK has voted, Article 50 of the 2009 Lisbon Treaty will soon be invoked and over the next couple of years we’ll negotiate (hopefully sensibly) our way out of the European Union.  Of course I have no idea what those negotiations are going to result in but I also don’t really want to hang around and wait.  After all I’m trying to become financially independent in less than 6 months from here and retire early to the Med in less than 12 months.

It therefore seems worthwhile to get my initial thoughts down on paper which can then be modified as I learn what is happening and being negotiated.

Wealth to FIRE

Post referendum there was plenty of economic doom and gloom around however there was also plenty of exuberance in the days prior.  Priced in £’s my portfolio actually ended the week 1.9% higher than my position at the end of last week and priced in Euro’s I’m down 1.2%.  Hardly FIRE destroying leaving me very much still on for financial independence in less than 6 months.

My path trodden to financial independence
Click to enlarge, My path trodden to financial independence

As a person positioned as a UK investor right now I’m also stress testing my portfolio against a £ to Euro exchange rate of 1.123.  It’s currently 1.2307 so this is still also looking good.

Getting in the door

One of the founding principles of the European Union was the free movement of its people across its countries borders.  The RIT family were planning on taking advantage of this to enable the move to the Med.  I would say there is a definite risk now, that with us Brexiting, this right will be taken away for UK passport holders not already resident in their new EU country.

Saturday 18 June 2016

My Early Retirement Financial Strategy and Portfolio

With FIRE now on the doorstep it’s time to finalise what my early retirement drawdown strategy and portfolio is going to look like.

Firstly, let’s look at the strategy and portfolio that has put me where I am today.  I first published it in detail in 2009 and then polished it slightly in 2012.  In brief it was about building significant wealth (at least for me) in quick time.  Quick time was less than 10 years which meant I needed to be accruing wealth in relation to My Number at just a little less than 1% per month.  A very aggressive target when I look at it that way in hindsight but one which provided Mr Market behaves for just a few more months looks real.

By living frugally while focusing on earning more I believed I could Save Hard.  To date my Savings Rate has averaged around 52% of Gross Earnings so that has played out.  This then advantaged me when it came to investing as I didn’t have to take great investment risk giving me an increased probability of success.  I called it Investing Wisely.  As it turns out since starting my annualised investment return has been 5.9% which is 3.3% after inflation.

When I came out I stated that at the point of Early Retirement I wanted wealth of £1 million (it was actually £1,011,000).  Today my trusty Excel spreadsheet is telling me that once I hit £1,023,000 I’m good to retire.  At this point it’s then no longer about building wealth but instead the simple problem of ensuring I outlive my wealth which will be drawn on as I’ll have no other earnings.  I suspect it may require a slightly different strategy and investment portfolio to that which I have today.  That said the principles of tax efficiency, low expenses and a diversified investment portfolio, with a key decision of what Bond to Equity Allocation Percentage at its core, I intend to keep.

Given the seriousness of this topic it’s about now that I have to pop in a wealth warning:  History is not a predictor of the future, this is not financial advice, I’m not a financial planner and I’m just an average person who’s made investment mistakes on a DIY Investment journey to Financial Independence.  The post is also just for educational purposes only and is not a recommendation of any type.  Ok let’s move on...

My current estimates, based on my forecast FIRE date, suggest I’ll actually overshoot my FIRE wealth Number with circa £1,117,000.  A Mediterranean life will then mean a life priced in Euro’s.  The average exchange rate with the £ since the Euro’s inception has been 1.3742.  I’m not going to bank on that.  Instead, I’m going to use the worst average year since inception, which was 2009, with its rate of 1.123.  That gives me EUR1,254,000 of wealth to buy a home with and live from for the rest of my life.  I’m going to assume a 40 year retirement period.

Saturday 11 June 2016

Valuing the Housing of England and Wales at County Level – Year 4

In my view (and unfortunately) house prices in this great country are driven by Affordability, which is one’s ability to service debt at current interest rates, and not by Value.  This is one reason why I’ve never bought a home, and now don’t intend to buy, choosing instead to move overseas.  So when/if salaries increase, the price of debt decreases and/or the government provides ‘help’ we can expect house prices to rise.  Let me demonstrate with one simple example showing how just one of these affects prices – average house prices vs average employee earnings:

Average house prices vs average employee earnings (in England and Wales at County level)
Click to enlarge, Average house prices vs average employee earnings (in England and Wales at County level)

For me, clearly mistakenly, I’ve always been more focused on Value.  With this in mind every year at around this time I preparing a house Valuation metric that goes beyond that generally presented by the mainstream media by getting more granular and trying to Value housing at County level.  For completeness last year’s efforts can be seen here and you can track back to previous years from there.

My definition of Value is simply how many years of gross earnings (median and average) are required to buy an average house.  This is a simple average Price to Earnings Ratio (P/E) and is not unlike how some might value a company share.

For House Prices I am using average house prices as published by the Land Registry. This is calculated by using:
  • The Land Registry House Price Index (HPI) dataset.  This index uses repeat sales regression (RSR) on houses which have been sold more than once to calculate an increase or decrease.  As it analyses each house and compares the latest buying price to the previous buying price it is by definition mix adjusting its data also.  It uses all residential property transactions made in England and Wales since January 1995 so covers buyers using both cash and mortgages.
  • Average prices are then calculated by taking Geometric Mean Prices (as opposed to an arithmetic mean), to reduce the influence of individual values, from April 2000 and adjusting these prices in accordance with the Index changes.  They are seasonally adjusted. I am using the latest published data which comes from March 2016.  

The Valuation analysis is arranged according to the Regions and County’s defined by the Land Registry and is shown in the Table below.  Unlike the mainstream media I am calling high house prices bad (unsurprisingly the County with the highest house price is London at £534,785 and is shown in dark red) and low house prices good (the County with the lowest house price is Blaenau Gwent at £69,384 and is dark green) with all other prices shaded between red and green depending on house price.