Saturday 7 March 2015

18 Months to Go?

6 Months ago, almost to the day, I made the bold statement that I had 2 Years to Go before Financial Independence beckoned and optional Early Retirement was staring me in the face.  If I'm on plan for that then today I need to be writing that I have 18 Months to Go.  So do I?  As always let’s run the numbers.

Saving Hard

One of the key pillars of my overall Retirement Investing Today strategy is to find ways to earn as much as possible while finding ways to spend as little as possible by living healthily and intentionally well below my means.  The difference between the two is savings that can be invested to start working for me.  So how have I done on this front given that to be successful I need to maintain a savings rate of 55% of gross earnings, which I define as Savings plus Employer Pension Contribution divided by Gross Earnings (ie before HMRC takes their portion) plus Employer Pension Contribution?  Against that 55% target I've actually averaged a savings rate of 53.9% over the last 6 months.

Note that here I don’t include any investment returns, EBay sales, savings account interest, credit card cashback or 5p coins picked up on the roadside as earnings.  I do however make it hard on myself by counting the tax from both my salary and investments/interest as spending which encourages me to structure my finances as tax efficiently as possible.

On a chart my savings look like this:

Average Savings Rate
Click to enlarge

So I've failed to meet this objective but I'm actually still happy with the result.  Why, because you’ll see the savings dip occurred just before and just after the end of 2014 during which time as a family we conducted some Early Retirement research by spending some time in one of our preferred Early Retirement locations – Puglia, Italy.  We went in the depths of winter as we know that part of the world is beautiful in summer as a tourist but we’re talking about living there permanently and so wanted to see it in its worst light.  The conclusion?  As a tourist location it’s still a pretty impressive part of the world:

Trullo in Alberobello, Puglia
Click to enlarge, Trullo in Alberobello, Puglia

Saturday 28 February 2015

Active vs Passive Portfolio Rebalancing

When I set out my Investing Strategy some years ago, which included my initial asset allocation as well as how that allocation would change over time, I effectively established a portfolio risk vs return characteristic.  Over time that asset allocation has and will continue to change as different asset classes provide different returns in relation to each other.  To recapture the required portfolio risk vs return characteristic I then need to periodically rebalance the portfolio.  Importantly, I rebalance to manage risk rather than to maximise returns.  Over the years I've found that I follow effectively two types of rebalancing – what I call Active and Passive Rebalancing.

Active Rebalancing

Active is what you will predominantly read about in books or online.  There is not much conflict out there as to what it is.  It is simply selling down the assets that have performed the best and using those funds to top up those assets that have performed the worst.  What you will see plenty of conflict about is the frequency of when you should rebalance.  I've seen preset frequencies talked about which could be monthly, quarterly, half yearly, annually or even longer periods.  It could also be triggered by a memorable date such as a birthday or the New Year.  Personally I'm conscious that every time I rebalance Actively it’s likely I’ll be staring down the barrel of trading expenses, possibly taxes and certainly lost time that could be spent doing something else.

With this in mind and given my whole mantra has always been to minimise expenses and taxes I instead adopted and have stayed with a valuation based rebalancing approach.  This is not complicated and is simply if any asset allocation moves more than 25% away from a nominal holding I will either sell or buy (as appropriate) enough of that asset to move the allocation back to nominal.  This methodology plus the Passive Rebalancing element, which I’ll cover in a minute, has meant I've been forced to do very infrequent rebalancing.

Saturday 21 February 2015

Why I Hold Gold in my Portfolio

In my experience if you’re discussing UK Equities as part of an investment portfolio its validity is unlikely to be challenged and any response is likely to be fairly passive.  A typical response might be something like what percentage allocation do you have.  If you say to somebody that you hold Gold then the responses can be far more variable.  At the extreme they can range from I don’t believe in Gold as an investment as it doesn’t pay a dividend because it just sits there looking shiny to I’m 100% invested in Gold, guns, ammo and tinned beans.

Within my own portfolio I target a holding of 5%.  So why do I hold gold?  It’s for the same reason that I buy property or gilts on top of my equities.  To quote Bernstein’s The Intelligent Asset Allocator it’s simply because ‘Dividing your portfolio between assets with uncorrelated results increases return while decreasing risk’ which is a key concept within Modern Portfolio Theory (MPT).  Bernstein continues with ‘Mixing assets with uncorrelated returns reduces risk, because when one of the assets is zigging, it is likely that the other is zagging.’  The keyword in the first quote is uncorrelated.  In the book he works up some examples to validate these statements.

Let’s run a simple analysis looking to see if we can find an example of gold being uncorrelated with another asset class.

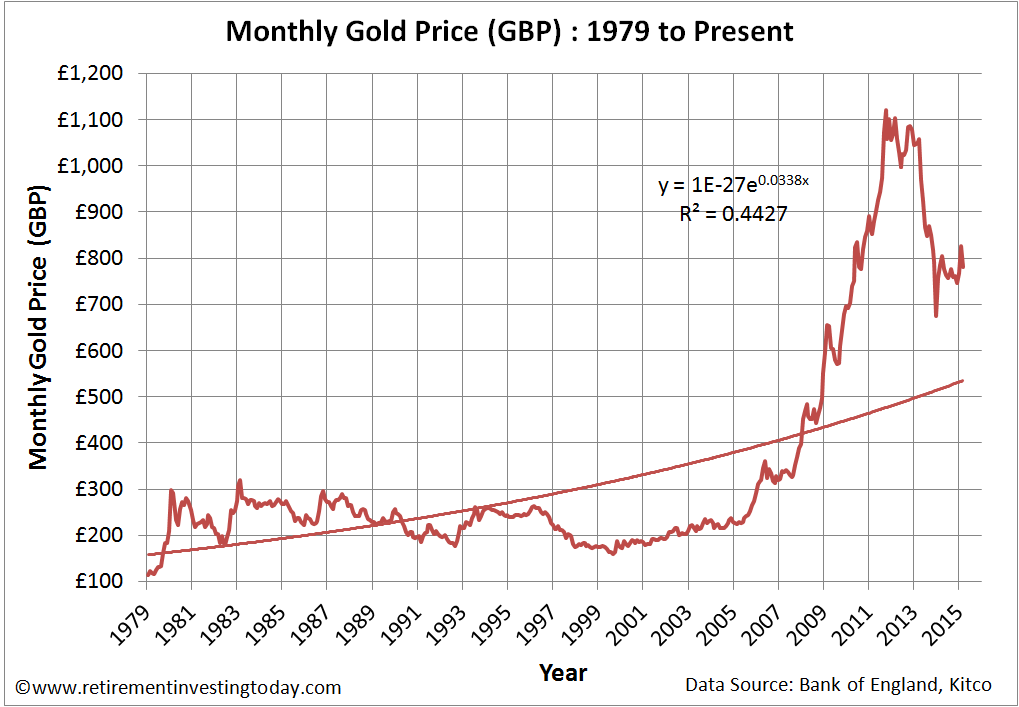
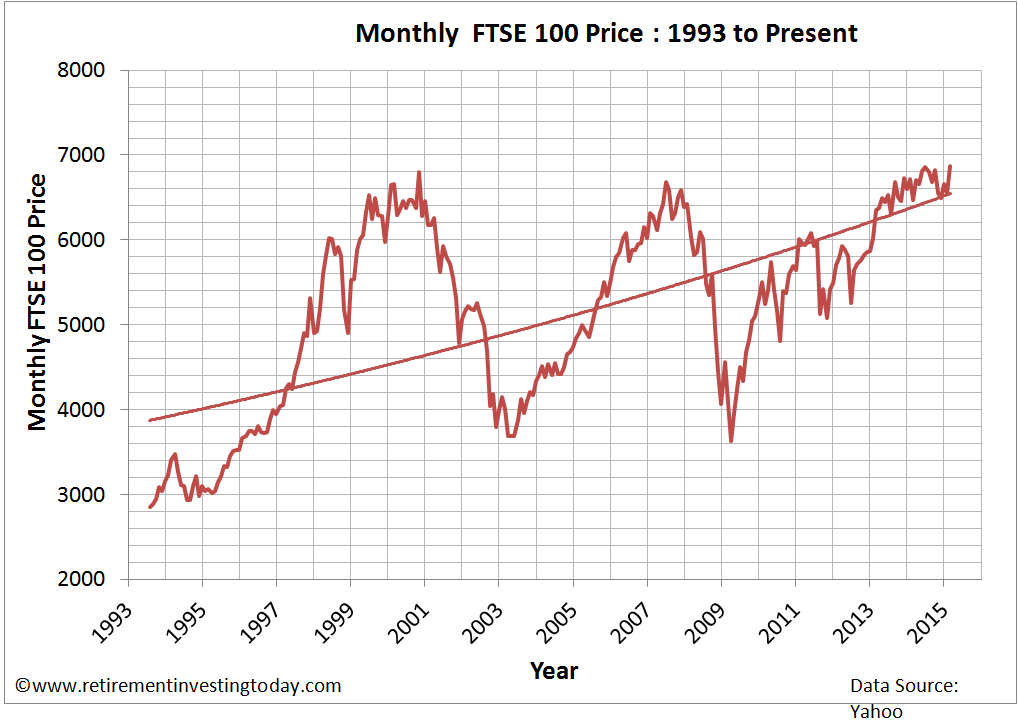
My first chart shows how the Monthly Gold Price in Pounds Sterling (£’s) has changed since 1979.  Over the past year its Price has fallen by 0.6%.  We looked in detail at the FTSE100 last week so let’s use that as a different asset comparator as that dataset is up to date.  Over the past year the Price of the FTSE100 has risen 7.0%.

Gold Priced in Pounds Sterling (£)
Click to enlarge

Diverting quickly for completeness, as I always like to show charts in Real terms to remove the emotion that comes with the unit of measure continually being devalued by inflation, let me quickly also show the Real Gold Price in Pounds.

Real Gold Priced in Pounds Sterling (£)
Click to enlarge

Saturday 14 February 2015

Valuing the UK Equities Market (FTSE 100) - February 2015

I have an investment strategy that requires me to moderate my equity holdings based upon my view of current equity market values.  I run this valuation monthly for the Australian, US and UK Equity markets.  While I run it monthly I've just realised that I haven’t shared that analysis for the UK market for 4 months now.  So without further ado let’s run the numbers for all to see.

Firstly nominal values.  Between yesterday and the 2nd February 2015 (month on month) prices are up 5% and since the 3rd February 2014 (year on year) prices are up 6.3%.

Chart of the FTSE 100 Price
 Click to enlarge

Regular readers will know I'm not a fan of this type of chart as:
  • the unit of measure, £’s, is being constantly devalued through inflation (although in the current market one wonders for how much longer); plus
  • Pricing should be plotted on a logarithmic scale as opposed to a linear one as by using this scale percentage changes in Price appear the same.  

So let’s correct the chart for the devaluation of the £ through inflation (I use the Consumer Price Index (CPI) here) and convert to a log chart.  This normalised chart shows that Friday’s FTSE 100 Price of 6,874 is actually still 26% below the Real high of 9,317 seen in October 2000.  We’re also still 23% below the last Real cycle high of 8,152 seen in June 2007.  We are therefore a long way from previous highs.

Chart of the Real FTSE100 Price
Click to enlarge

Saturday 7 February 2015

The Investment Products to Build a Portfolio should be Trivial : Time Suggests Otherwise

Once you’ve done plenty of your own research (which in my opinion must include a thorough read of Tim Hale's Smarter Investing: Simpler Decisions for Better Results), decided upon the different asset classes that will form your balanced investment portfolio and then decided on the percentage allocation to those different asset classes it’s time to select (and buy) the Investment Products that will give you that real world balanced portfolio.

The theory says that this should be trivial and achievable with only a small amount of products.  At an extreme it could be nothing more than a Vanguard LifeStrategy Equity Fund.  Having now been at this investing game for over 7 years I've personally found that in its infancy you will need more products than you really should and you’ll also not always be able to select the optimum products so will end up with compromise.  Then as time progresses you will end up with more and more stamps for your stamp collection.

There are many reasons for this but some might include spreading provider (whether wrapper and/or investment) risk, new products that give benefits over what you currently hold, inability to buy your preferred product in a particular account, tinkering because personal finance is a hobby and even as a result of some good old fashioned investing mistakes.

Let me demonstrate with my own investment portfolio.  These are the top level asset classes and allocations to each class I'm currently holding:

RIT Low Charge Investment Portfolio
Click to Enlarge

Looks simple doesn’t it?  Now let’s look in detail at ALL of the investment products that make up my portfolio.

UK Equities:
  • Vanguard FTSE UK All Share Index Unit Trust (Income).  This fund tracks the FTSE All Share Index, has a TER of 0.08% and a Stamp Duty Reserve Tax at initial purchase of 0.2%.  I'm happy with this fund however there is one small consideration that would make me 100% satisfied.  I'm with the ermine in that psychologically during retirement I would very much prefer to live only on dividends rather than having to also sell down capital.  In partial conflict with this the Vanguard fund pays dividends only once per year.  One idea to keep expenses low but increase dividend frequency would be to create a pseudo All Share Index.  85% of the FTSE All Share Index is the FTSE100 Index with the majority of the remainder being FTSE250.  By buying 75% Vanguard FTSE100 UCITS ETF (VUKE) and 25% Vanguard FTSE100 UCITS ETF (VMID) results in a TER of 0.09% but dividends paid quarterly instead of yearly.  At this time I won’t act on this as in retirement I’ll be keeping at least 12 months essential living expenses in cash so should be able to manage with annual dividends.
  • My High Yield Portfolio (HYP) which continues to build nicely.  This portfolio has a TER of 0.0% (but it does have buy/sell dealing fees and 0.5% stamp duty on initial purchase) and as a believer of expenses matter that’s fine by me.
  • I'm generally happy with what’s going on with the UK Equities portion of my portfolio.