Saturday 7 February 2015

The Investment Products to Build a Portfolio should be Trivial : Time Suggests Otherwise

Once you’ve done plenty of your own research (which in my opinion must include a thorough read of Tim Hale's Smarter Investing: Simpler Decisions for Better Results), decided upon the different asset classes that will form your balanced investment portfolio and then decided on the percentage allocation to those different asset classes it’s time to select (and buy) the Investment Products that will give you that real world balanced portfolio.

The theory says that this should be trivial and achievable with only a small amount of products.  At an extreme it could be nothing more than a Vanguard LifeStrategy Equity Fund.  Having now been at this investing game for over 7 years I've personally found that in its infancy you will need more products than you really should and you’ll also not always be able to select the optimum products so will end up with compromise.  Then as time progresses you will end up with more and more stamps for your stamp collection.

There are many reasons for this but some might include spreading provider (whether wrapper and/or investment) risk, new products that give benefits over what you currently hold, inability to buy your preferred product in a particular account, tinkering because personal finance is a hobby and even as a result of some good old fashioned investing mistakes.

Let me demonstrate with my own investment portfolio.  These are the top level asset classes and allocations to each class I'm currently holding:

RIT Low Charge Investment Portfolio
Click to Enlarge

Looks simple doesn’t it?  Now let’s look in detail at ALL of the investment products that make up my portfolio.

UK Equities:
  • Vanguard FTSE UK All Share Index Unit Trust (Income).  This fund tracks the FTSE All Share Index, has a TER of 0.08% and a Stamp Duty Reserve Tax at initial purchase of 0.2%.  I'm happy with this fund however there is one small consideration that would make me 100% satisfied.  I'm with the ermine in that psychologically during retirement I would very much prefer to live only on dividends rather than having to also sell down capital.  In partial conflict with this the Vanguard fund pays dividends only once per year.  One idea to keep expenses low but increase dividend frequency would be to create a pseudo All Share Index.  85% of the FTSE All Share Index is the FTSE100 Index with the majority of the remainder being FTSE250.  By buying 75% Vanguard FTSE100 UCITS ETF (VUKE) and 25% Vanguard FTSE100 UCITS ETF (VMID) results in a TER of 0.09% but dividends paid quarterly instead of yearly.  At this time I won’t act on this as in retirement I’ll be keeping at least 12 months essential living expenses in cash so should be able to manage with annual dividends.
  • My High Yield Portfolio (HYP) which continues to build nicely.  This portfolio has a TER of 0.0% (but it does have buy/sell dealing fees and 0.5% stamp duty on initial purchase) and as a believer of expenses matter that’s fine by me.
  • I'm generally happy with what’s going on with the UK Equities portion of my portfolio.

Sunday 1 February 2015

Increase Earnings to Accelerate Progress to Financial Independence

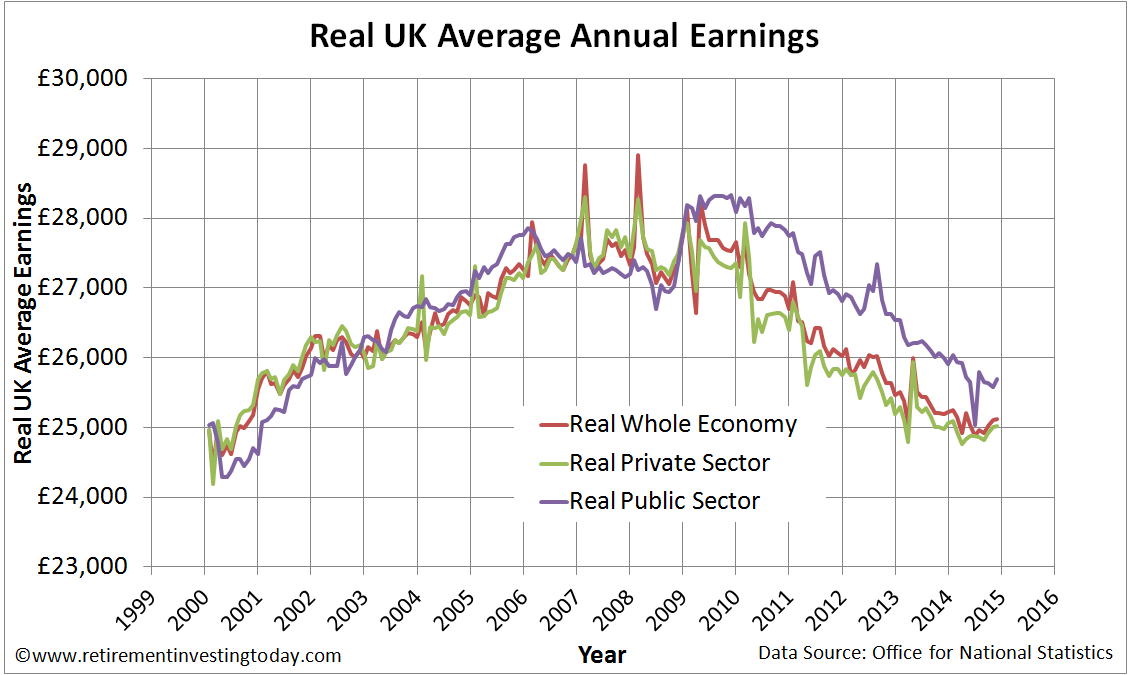
UK pay or earnings seems to have reached the main stream media again.  By my calculations Average Whole Economy Annual Earnings are increasing at a rate of 1.7% with inflation over the same period at 2.0%.  So on the whole the average punter’s purchasing power continues to be eroded.  To be honest I can’t say I'm surprised and think this is going to continue for a long time yet.  As the world continues to globalise then the difference between poorer salaried and richer salaried countries must close.

The Private Sector is fairing a little better than average and has kept pace with inflation having risen by 2.1%.  Austerity does look to be biting the public sector though with increases of 0.8% which is well below inflation.

The chart below shows the wider real adjusted for inflation UK earnings story.  The summary is pretty simple – real UK earnings for both the public and private sectors are still well below those of 2007 to 2009.  Though is that a sustainable uptick I can start to see beginning to occur before me?  Given what I’ve said above I’m not convinced.

Index of UK Whole Economy, Private Sector and Public Sector Average Annual Earnings Corrected for the Retail Prices Index (RPI)
Click to enlarge

For anyone seeking Early Financial Independence, giving the option of Early Retirement, finding methods to increase earnings is extremely important.  Importantly this does not have to mean increasing your day job earnings but instead can involve a new business, a second job, a side hustle, even selling stuff you no longer need now that you’ve opted out of consumerism so think creatively. So why is it important?  I believe there are 3 elements to reaching the Financial Independence – generating cash savings, investing those savings to gain a return and then understanding how much wealth you need to accrue and how to manage it before calling it a day.

Sunday 25 January 2015

The RateSetter Experiment (6 month update)

My low charge investment portfolio today holds 7.4% of my total wealth in cash.  I currently use 2 main repositories for this.

Retirement Investing Today Diversified Investment Portfolio
Click to enlarge

The first of these is a Yorkshire Building Society (YBS) Savings Account which 6 months ago was earning an interest rate of 1.25% AER.  Looking today they seem to have stealthily reduced that to 1.24% AER for which I have received no notification.  YBS, if you’re reading this, I hope you make good use of that extra 0.01%!  As a higher rate tax payer and with inflation now running at 2.1% this savings account is allowing my savings to be eroded at the rate of 1.36% per year.  So every day that goes by a pound held in this account has less purchasing power than it did the day before.  I’m going backwards.  If you happen to be a basic rate taxpayer then you’re also going backwards, albeit at a more leisurely 1.11%.

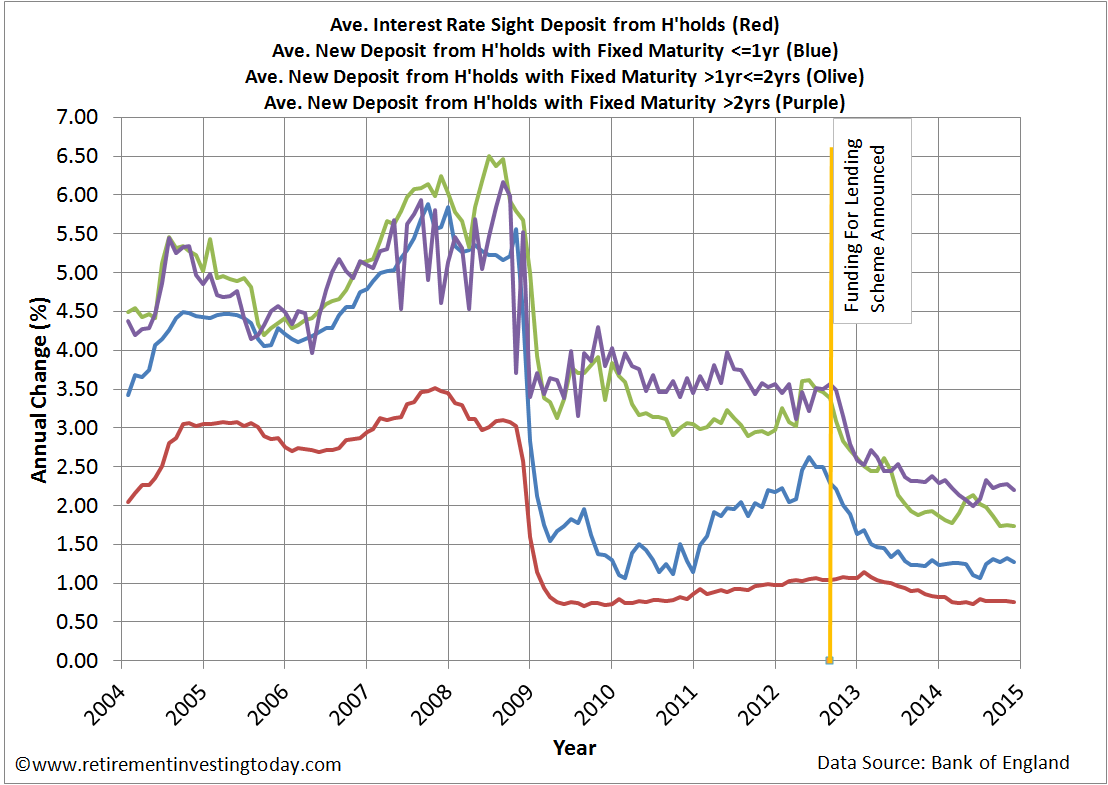
Little to no movement here is of course no surprise given the latest average savings account data from the Bank of England shown in the chart below.  It shows instant access savings rates up a mere 0.03% in the last 6 months.

Average UK Savings Account Interest Rates
Click to enlarge

What alternative do I have?  Well moneysavingexpert.com tells me the Santander 123 current account which pays interest of 3% AER on balances between £3,000 and £20,000 is still hanging around.  It of course also comes with a monthly fee and minimum deposit requirements but it also offers cashback opportunities although I already get that with my American Express Platinum cashback credit card.  Personally, I prefer clean simple accounts and today that looks to be Coventry Building Society with a 1.4% interest rate but these accounts can’t be run online.  I mean honestly an account that cannot be accessed and managed online.  Do the Directors have shares in Royal Mail or something or are they just trying to grab headlines...  For now I’ll just leave what I have in YBS and continue to deposit new savings into my second newer different risk profile repository, Peer to Peer lending (P2P).

Saturday 17 January 2015

How about those falling oil prices – Adding BP to my High Dividend Yield Portfolio

Unless you've been living under a rock you will be very familiar with oil prices falling for a few months now.  Regular readers will know that I have a monster commute so I’m certainly noticing the difference at the petrol pump.  That said I also have Royal Dutch Shell within my High Yield Portfolio (HYP) which as I write this post is now under water by 15.3%.   Search online for some oil data and you won’t have to go far before you find a chart not unlike this:

West Texas Intermediate Crude Price ($/barrel)
Click to enlarge

I have a problem with these types of charts because the unit of measure used to compare oil against is being constantly devalued through inflation.  Let’s therefore correct for that:

Real West Texas Intermediate Crude Price ($/barrel)
Click to enlarge

With West Texas Intermediate Oil (WTI) for February delivery settling at $48.69 a barrel on the New York Mercantile Exchange the real oil price is certainly now below the trend line.  It’s also 15% below the real average of $57.08 but it’s 7% above the real median price of $45.57.   What do you think, is oil now over or under valued?  Personally, I’m not even going to think about it because I’ve proven in the past that I’ll probably lose money if I do.  What I do know is that the oil price change has had a big effect on the share price of Oil & Gas Producers like Shell and BP.  It’s also had a big effect on Oil Equipment, Services & Distribution companies like AMEC Foster Wheeler and Petrofac.

Saturday 10 January 2015

2014 In Review

Retirement Investing Today charts my financial journey to hopefully Early Financial Independence with Early Retirement then being an option at any time thereafter.  This is not a model or a demonstration journey.  It is my real DIY financial life warts and all.  Get it right and it’s smiles all round.  Get it wrong and I have a long compulsory work life ahead of me followed by a derisory State Pension thereafter.

The headline numbers are that in 2014 net wealth has increased by 13.2% and spending has decreased by 5.1% allowing me to move significantly closer to Early Financial Independence.  In line with my Plan, Do, Check, Act (PDCA) approach let’s now Check in detail by focusing on the three key focus areas that I believe are essential to get over the Financial Independence line - Save Hard, Invest Wisely and Retire Early.

SAVE HARD

Saving Hard is simply defined as Gross Earnings (ie before taxes) plus Employee Pension Contributions minus Spending minus Taxes.  Earn more and one is winning.  Spend less or pay less taxes and you’re also winning.  Savings Rate is then Savings divided by Gross Earnings plus Employee Pension Contributions.  To make it a little more conservative Taxes include any taxes on investments but Earnings include no investment returns.  This encourages me to continually look for the most tax efficient investment methods.

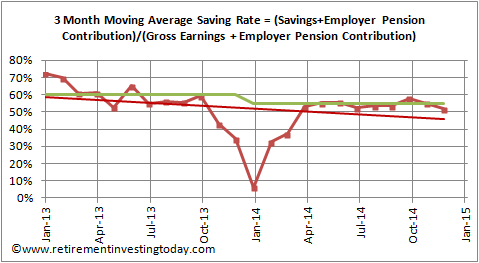
On the Gross Earnings front it’s been a great year with total earnings having increased by 37.7%.  Spending on the other hand has decreased by 5.1% by continuing to challenge all spending.  My one fail is that taxes are up a long way.  This is caused by the earnings increase but also more investment taxes as the portfolio continues to grow and is now significant.  The end result is the chart below which shows an average 2014 Savings Rate of 48.1% against a target of 55%.  The majority of the big gap was all caused by my good friend HM Revenue & Customs making a pigs ear of my taxes in years gone by and then chasing me for it at the start of this year.  By the back half of this year that Savings Rate had recovered to 52.8%.

RIT Savings Rate
Click to enlarge

Saving Hard score: Conceded Pass.  Savings contributed 7.8% of my net wealth increase.  I’m also earning more and spending less but my big problem is taxes which I’m struggling to control.  Any extra £ that I now make is taxed at the Higher Rate of 40% plus 2% National Insurance plus as my non-tax efficient investments grow in size I’m being taxed on these as well.  I could solve some of this by increasing personal pension contributions but I don’t want to go there for 3 reasons:

  • They’re very open to tinkering by government which includes extending the age at which you can access them.  That’s not conducive to Early Retirement.
  • I’m already making big pension contributions.  2014 saw 71% of Savings put into them.
  • I may need a big cash or cash like pile to be able to buy (not mortgage) my family home in the not too distant future.