Sunday 10 February 2013

UK, US, Australian + the PIGS Government 10 Year Government Bond Yields – February 2012 update

10 Year UK, US and Australian Government Bond Yields 
Click to enlarge

 Click to enlarge

I haven’t published these datasets for 20 months now because as far as the UK is concerned it’s really been status quo.  The UK Government have continued to run a budget deficit that isn’t sustainable.  There isn’t any of the promised austerity because government spending is actually rising.  This combined has resulted in the UK National Debt reaching around £1.13 trillion today.  That’s £18,021 of Debt for every man, woman and child in the UK.  Less than half of the population work in the UK, 29.17 million people working against a population of 62.64 million, so comparing the debt to this group means a debt of £38,699 for every worker. 

Government forecasts project the debt continuing to grow quickly with it reaching £1.5 trillion by 2016.  Meanwhile in parallel the Bank of England has “bought” £375 billion (33%) of that debt through the Quantitative Easing (QE) programme.  This has had the effect of forcing UK bond yields down to historic lows when under the scenario described in the first paragraph yields should have risen which would have forced the government to take action rather than masking the problem.  Now it’s important to remember that for bonds already in circulation that as yields fall prices rise and that’s what we’ve been seeing happening for a number of years now.  It is however important to remember that the opposite can also happen.  Should that happen not only would the cost of borrowing for the Government rise but also other debts like mortgages would also rise.  That would reduce affordability and would in my opinion reduce house prices (and other asset prices) helping the value argument here.  Instead of asset price deflation we’re seeing just about every asset type either holding or increasing in nominal value including housing, shares and hard assets like gold which to me seems to be making the problem we have even worse.  

I’m therefore watching government debt yields closely and what its showing is that since August 2012 those yields have been rising despite the Bank of England announcing another £50 billion of QE in July 2012.  This is not showing in mortgage rates yet because the Treasury and Bank of England are distorting the market independently there with the Funding for Lending Scheme. 

Saturday 9 February 2013

UK Savings Account Interest Rates – February 2013 Update

The UK Treasury and Bank of England’s £80 billion (or £1,277 for every man, woman and child in the UK) Funding for Lending Scheme continues to hurt savers.  The banks currently have no need to borrow money from us savers when they can go directly to the Bank of England for a nice low rate of 0.25% per annum providing they meet a few T&C’s.

Money Saving Expert now tells us that if you are in the market for an easy access savings account you can get an interest rate of 2% AER with Derbyshire.  Forget to switch after 31 March 2014 to the next bank or building society offering the highest interest rate at that time and that becomes 0.5%.  Last month you could get 2.35% on accounts offering a bonus for a fixed period of time and back in June 2012 you could get 3.2% AER variable with Santander reducing to 0.5% after 12 months.  So in less than 12 months the best rates being paid have fallen by more than a third.

Choose to go for a no nonsense easy access savings account (always my preferred option) that available interest rate is also 2% today from Virgin.  Last month the best buy was 2.3% AER with West Bromwich Building Society.  Back in June 2012 the best rate was 2.75% AER variable with Aldermore.

I must note that I’ve left the Santander 123 current account out of the analysis even though it’s currently paying 3% AER.  I have no time for this sort of account.  To me it’s made deliberately complicated and I don’t believe the average punter would have a hope of calculating whether this account is the best for them.  It pays the 3% only on balances between £3,000 and £20,000, requires a minimum deposit of £500 per  month, takes a £2 per month fee (remember you’ll pay tax on the 3% but won’t be able to claim against the £2) plus in the circles I move I hear of the poor customer service that Santander offers.  I can’t help but feel somewhere in the small print I’m bound to lose out against a simple no nonsense account.  If somebody is having success with this account please do comment below as I’m sure many readers (I know I certainly would) would like to know if you are seeing success.

Wednesday 6 February 2013

Simplifying the Complex Pension Problem

 Ask anybody at a party or family gathering about personal Pensions, whether that be a now all to rare Defined Benefit Scheme or a Defined Contribution Scheme (such as a Stakeholder Pension, Group Personal Pension, the new National Employment Savings Trust or (NEST) Pension or the ultimate in DIY Pension Provision, a Self Invested Personal Pension (SIPP)) and it’s likely they’ll glaze over.  From my own experiences I feel this occurs for three main reasons – upbringing or culture, mistrust and lack of knowledge.  Let’s look at each of these in turn.

Upbringing or culture

The vast majority or people learn from a young age to spend and save what’s left.  That philosophy is then continually reinforced through a never ending bombardment of advertising which not only encourages us to spend what we earn today but also that it’s ok to spend what you haven’t yet earned today.  It’s a fairly old post now but if only people were taught to pay themselves first.  I’m the first to admit that I fell for it until I was 35 years of age.  The problem is who has an incentive to educate people about this?  The Government / Bank of England don’t, particularly now, as we’re in a spiral where they need us savers to spend.  They are actually trying to do the opposite and educate us to spend by doing all they can to erode our savings through forcing negative real interest rates upon us.  The Corporations of the world certainly don’t want you to gain this knowledge as you wouldn’t be then contributing to revenue today.  The only logical place I can see it coming from is family, friends or in very limited cases somebody stumbling across a site like this and believing what I write.  Unfortunately though it’s a spiral because if family and friends don’t know about it how can they pass that knowledge across.

Mistrust

The simple mention of two words – Equitable Life – is a good place to start.  This however is actually a symptom not the cause of the Mistrust because most Pensions don’t actually operate like this.  The actual cause is the vast majority of the Financial Services sector (which includes the FSA) who fail to educate with the full story but instead only present the side that helps them.  People are in my opinion right to go in to a Pensions transaction sceptical and mistrusting.  Let’s look at a simple example.  The website of most Pension provider’s will probably say something like the government is trying to help us save for our retirement.  If you’re a basic rate tax payer then for every £8 you invest the government will top up your pension with a further £2.  They’ll probably then go on to say if you’re a higher rate taxpayer you may be able to claim even further tax relief.  The bit they always seem to forget to inform us about is that Pensions, excluding the 25% Tax Free Lump Sum (TFLS), are actually just a tax deferral scheme.  You aren’t taxed on the way in but you are taxed on the way out.  If you’re a 40% taxpayer and plan to be a 20% taxpayer in Retirement or if your employer makes a contribution if you do then it’s probably worth it but what about the person who’s a 20% tax payer now, will be a 20% tax payer in retirement and doesn’t take advantage of the TFLS (after all it’s not compulsory and would require some knowledge to understand).  Is it worth it for him or should he just save in an ISA?.

I also feel they seem to make Pension products sound deliberately complicated to ensure that you use them instead of going DIY.  This then also enables them to maximise how much they skim for themselves without you immediately noticing.  How many people out there have and are paying large expenses today and will then find in 30 years that their Pension has delivered nothing like what they thought it would.  It’s short term thinking and self defeating but unfortunately a lot of human nature is based around greed.  Take a fair fee for helping somebody, which I actually believe some providers are doing today, then in 30 years that somebody has seen some success and so they make a recommendation to their children.  Next minute the snowball is rolling and everyone wants a pension.

Monday 4 February 2013

The S&P 500 Cyclically Adjusted PE (aka S&P 500 or Shiller PE10 or CAPE) – February 2013 Update

The US stock market has seen some large gains since New Year’s Eve. As I write this post the mid market price for the S&P500 is down 0.9% on the day at 1,499.8 but still up 5.2% in little over a month. Similarly, the Dow Jones is down 0.8% at 13,903.5 but is up 6.1% since the market close on the 31 December 2012. It’s therefore appropriate to run the standard Retirement Investing Today monthly update for the S&P500 Cyclically Adjusted PE (S&P 500 CAPE). Let’s see if the market is just exuberant or starting to head towards Irrational Exuberance.  Last month’s update can be found here.

As usual before we look at the CAPE let us first look at other key S&P 500 metrics:
  • The S&P 500 Price is currently 1,500 which is a rise of 1.3% on last month’s average close of 1,480 and 13.3% above this time last year’s monthly Price of 1,324.
  • The S&P 500 Dividend Yield is currently 2.1%.
  • The S&P As Reported Earnings (using a combination of actual and estimated earnings) are currently $88.85 for an Earnings Yield of 5.9%.
  • The S&P 500 P/E Ratio is currently 16.9 which is up from last month’s 16.8.

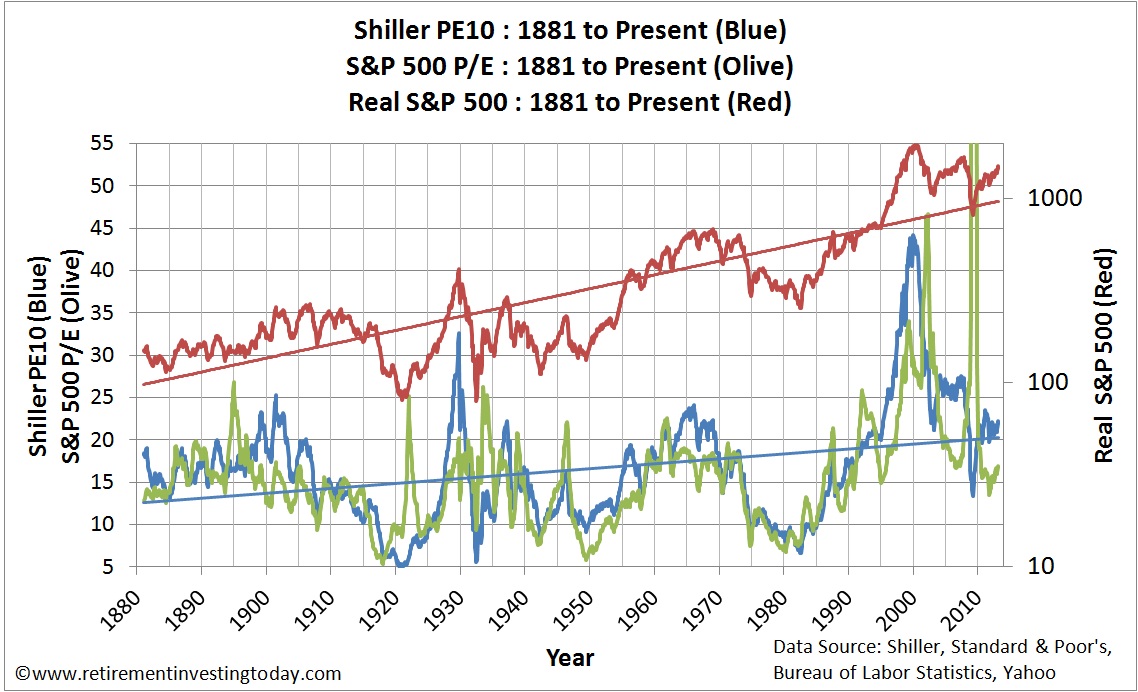
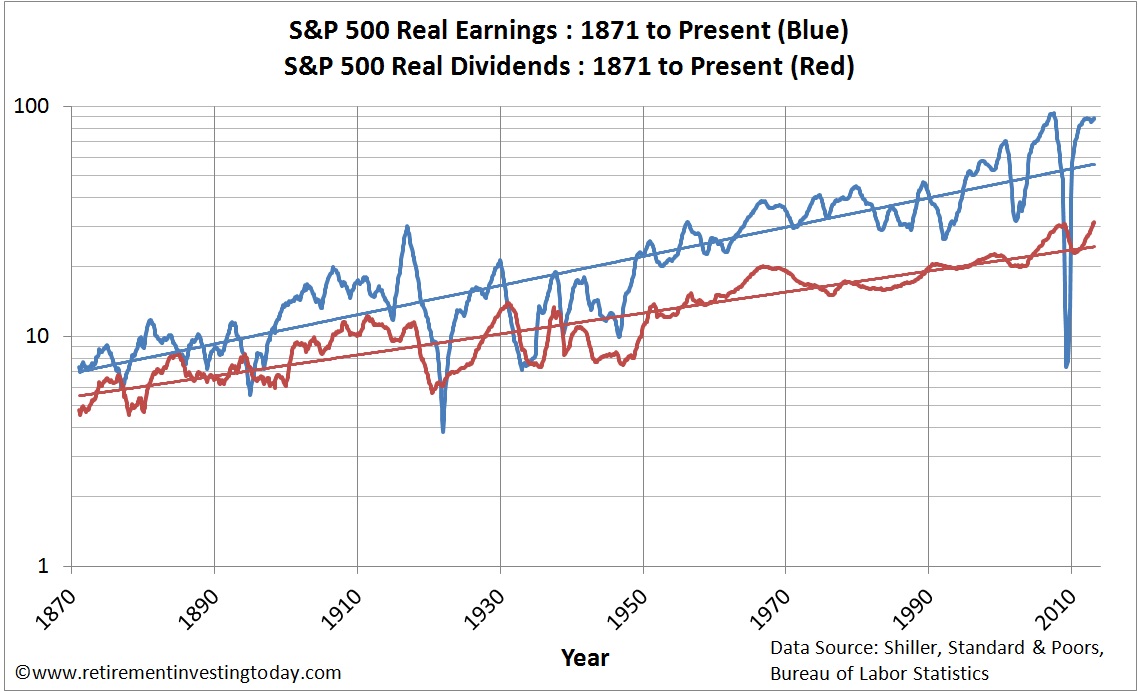
The first chart below provides a historic view of the Real (inflation adjusted) S&P 500 Price and the S&P 500 P/E.  The second chart below provides a historic view of the Real (after inflation) Earnings and Real (after inflation) Dividends for the S&P 500.

Chart of the S&P500 Cyclically Adjusted PE, S&P500 PE and Real S&P500
Click to enlarge

Chart of Real S&P500 Earnings and Real S&P500 Dividends
Click to enlarge

As always let us now turn our attention to the metric that this post is interested in which is the Shiller PE10.  This is also shown in the first chart which dates back to 1881 and is effectively an S&P 500 cyclically adjusted PE or CAPE for short.  This method is used and was made famous by Professor Robert Shiller.  It is simply the ratio of Real (ie after inflation) S&P 500 Monthly Prices to 10 Year Real (ie after inflation) Average Earnings. 

Saturday 2 February 2013

Calculating that Important Retirement Number

For anybody planning on a retirement, whether that’s Early Retirement Extreme, Early Retirement or a Typical Retirement not dependent on the whim of Government, based on a passive income stream generated provided by a portfolio which includes assets such as Equities and Bonds, then the amount of assets you need to accrue before pushing the retirement (financial independence) button is possibly the most important number that will be ever considered in your lifetime. 

Given the seriousness of the topic I must give the following Wealth Warning before we move on.  I’m just an average person on a DIY Investment journey to Financial Independence and am certainly not a Financial Planner.  The content of this post is for educational purposes only and is not a recommendation of any type.

For this post I am going to use a fictitious Average Joe who is in a similar position to me and is planning for Retirement.  This means he:
  • doesn’t intend to purchase an annuity but instead intends to only use Income Drawdown to Generate Gross Earnings (Earnings before Tax) from the portfolio;
  • doesn’t have the benefit of a Defined Benefit Pension or other income streams.  Therefore all of his Gross Earnings must come from the interest, dividends and capital growth of his portfolio;
  • doesn’t have rich parents who are going to leave him an inheritance; and
  • wants to maintain the same standard of living throughout retirement so will increase his Gross Earnings in line with inflation every year.

The actual calculation of the Retirement Number (how big a portfolio is required to retire) is actually very trivial and depends on only two numbers.  It’s getting those two numbers that is the difficult bit and where all the risk is.  The first number is what Gross Earnings do you want in retirement and the second number is what Initial Withdrawal Rate do you intend to start with.  The maths is simply Retirement Number = Gross Earnings / Initial Withdrawal Rate.

Let’s look at both of those numbers in detail.

What Gross Earnings do you want in retirement?

This is just a matter of sitting down and thinking about what expenditures you intend to have in retirement that will give you the standard of living you desire.  Here is a short inconclusive list of possible considerations:
  • You’re no longer saving for retirement so don’t need that portion of your current salary;
  • You’re possibly no longer working so may not need to be paying for transport to and from work plus other costs such as work clothes;
  • You’re hopefully tax efficiently invested in wrappers like ISA’s meaning you need a lower Gross Earnings than Gross Salary to give the same amount of money in your hand each month.
  • If you’re in the UK then the assets in your portfolio are taxed in a more friendly way than your current Salary meaning you also need lower Gross Earnings; and
  • You possibly own your home by now meaning you won’t be making those current mortgage payments. 

I calculated my retirement Gross Earnings back when I was in my mid thirties and first started on my journey towards financial independence.  Every year I have then up rated this amount by inflation to ensure my standard of living will be maintained as the pound is devalued.  When I hit retirement I intend to continue with this strategy.

On Retirement Investing Today I never reveal my Gross Earnings target because it’s just irrelevant.  Everybody has different needs, wants, risk tolerance and portfolio type meaning we all have a different Gross Earnings requirement.  To enable us to run an example let’s assume that our Average Joe requires Gross Earnings of £25,000 when measured in today’s £’s.