Sunday 24 June 2012

The S&P 500 Cyclically Adjusted PE (aka S&P 500 or Shiller PE10 or CAPE) – June 2012 Update

The S&P 500 closed on Friday at 1,335.  By my calculations I also have as Reported Earnings (using a combination of actual and estimated earnings) at $92.33.  Combining these two pieces of data gives us an S&P 500 P/E Ratio of 14.5. 

While interesting, for my own investment purposes, I do not use the P/E ratio.  Instead I use what I have called the Shiller PE10 which is shown in my first chart (effectively an S&P 500 cyclically adjusted PE or CAPE for short).  This method is used and was made famous by Professor Robert Shiller.  It is simply the ratio of Real (ie after inflation) S&P 500 Monthly Prices to 10 Year Real (ie after inflation) Average Earnings.

Tuesday 19 June 2012

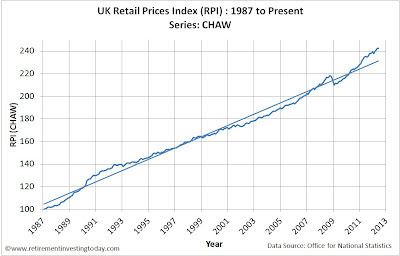
UK Inflation - May 2012

Today’s post looks at UK Inflation and specifically the Retail Prices Index (RPI) and the Consumer Prices Index (CPI).  It is not the most exciting post that I write, however it is an important piece of data for us to look at as it is needed to run a lot of the analysis that you see on Retirement Investing Today.  At this point in time the RPI is changing year on year at the rate of 3.1% with the index itself shown in my first chart.  This chart clearly shows the index still trending away from the long run trendline.

My second chart shows the annualised change in the RPI on a quarterly, six monthly and annual basis.  On an annualised quarterly basis we are seeing inflation still high at 4.2%. 

Sunday 17 June 2012

Average UK Savings Account Interest Rates – June 2012 Update

The interest paid on savings accounts is important to a lot of UK investors.  A quick look at Money Saving Expert shows us that if today you were in the market for an instant access account and were prepared to accept a little account complexity, including a big reduction in interest paid within a year or so, you could get savings interest of: 
-    3.2% AER variable with Santander.   Forget to switch in 12 months to the new highest rate bank and this becomes 0.5%.
-    3.17% AER with the Post Office.  Forget about this one and in 12 months you’re at 1.65%.
-    3.1% AER with the Nottingham Building Society.  This one works a bit differently.  If you close the account before the 30 September 2013 you only get 1% and after this date you also only get 1%.

Of course banks like Santander, rely on the vast majority of the Average Joe’s and Jane’s out there forgetting to switch after 12 months, at which point you’re quickly penalised.  Let’s say you start one of these savings accounts but then get distracted and only remember to switch to the new best offering in 15 months.  That 3.2% which looked ok has now become effectively 2.7%.  Leave it 18 months and you’re now at an effective rate of 2.3%. 

Thursday 14 June 2012

Severe Real S&P500 Bear Markets – June 2012 Update

As I write this post the S&P 500 is trading at 1,322.  If I correct for the devaluation of the US Dollar over the years (ie correct for inflation) we were at this value back in July 1997.  So in 15 years the value of companies in the S&P 500 have gone precisely nowhere.  Sure, as a private investor you would have been paid dividends over this period, but they have only averaged around 1.8% annually, making it pretty difficult to try and save for retirement.

My first chart today shows 3 periods in the US stock market since 1881 when similar conditions have prevailed.  I call these the historic severe bear markets and they are periods in time where from the stock market reaching a new high it then proceeded to lose in excess of  60% of its real (inflation adjusted) value.  The percentage change in value from the peak for each of these periods in time are shown in my second chart.  So what were these bear markets?

Saturday 9 June 2012

The ASX 200 Cyclically Adjusted PE (aka ASX 200 PE10 or ASX200 CAPE) – June 2012 Update


The ASX 200 closed on Friday priced at 4,063 which is a 12% fall from 1 year ago.  At this price I have earnings (which are 12-month trailing underlying profits) at 337 which results in a price earnings ratio (P/E Ratio) of 12.1.  In comparison I have calculated the S&P 500 P/E Ratio at 14.3 and the FTSE 100 P/E Ratio at 9.4 this month.

The history of the ASX 200 P/E Ratio since 1993 can be seen in my first chart today along with the Ratio I am personally far more interested in which is the ASX 200 PE10 (effectively  an ASX 200 cyclically adjusted PE or ASX 200 CAPE for short).  The method is based on that made famous by Professor Robert Shiller and in this instance it is simply the ratio of Inflation Adjusted Monthly ASX 200 Monthly Prices to Inflation Adjusted Average Earnings.  Today the ASX 200 PE10 sits at 13.9.  A full summary of relevant ASX 200 PE10 data follows:
  • ASX 200 PE10 = 13.9
  • Dataset Average PE10 = 22.1.  If this average was “fair value” then it indicates that today the ASX200 is 37% undervalued.  I’m not convinced of this though and think it is a result of a relatively short dataset but I’ll talk more of that later in this post.
  • Dataset Median PE10 = also at 22.1
  • Dataset 20th Percentile = 16.9
  • Dataset 80th Percentile = 27.5