Sunday 25 July 2010

Government supports the banks ripping off the average saver – NS&I Index Linked Savings Certificates suspended

I’m sure by now that most readers will be aware that this week National Savings & Investments closed for sale its RPI+1% index linked savings certificates (ILSC’s). If they stay closed for a long time or even reopen in a few months linked to the CPI instead of RPI its going to give me and I’m assuming many others a few problems. My retirement investing strategy uses NS&I ILSC’s extensively. I currently have 20.7% of my net worth ties up in them.

Wednesday 21 July 2010

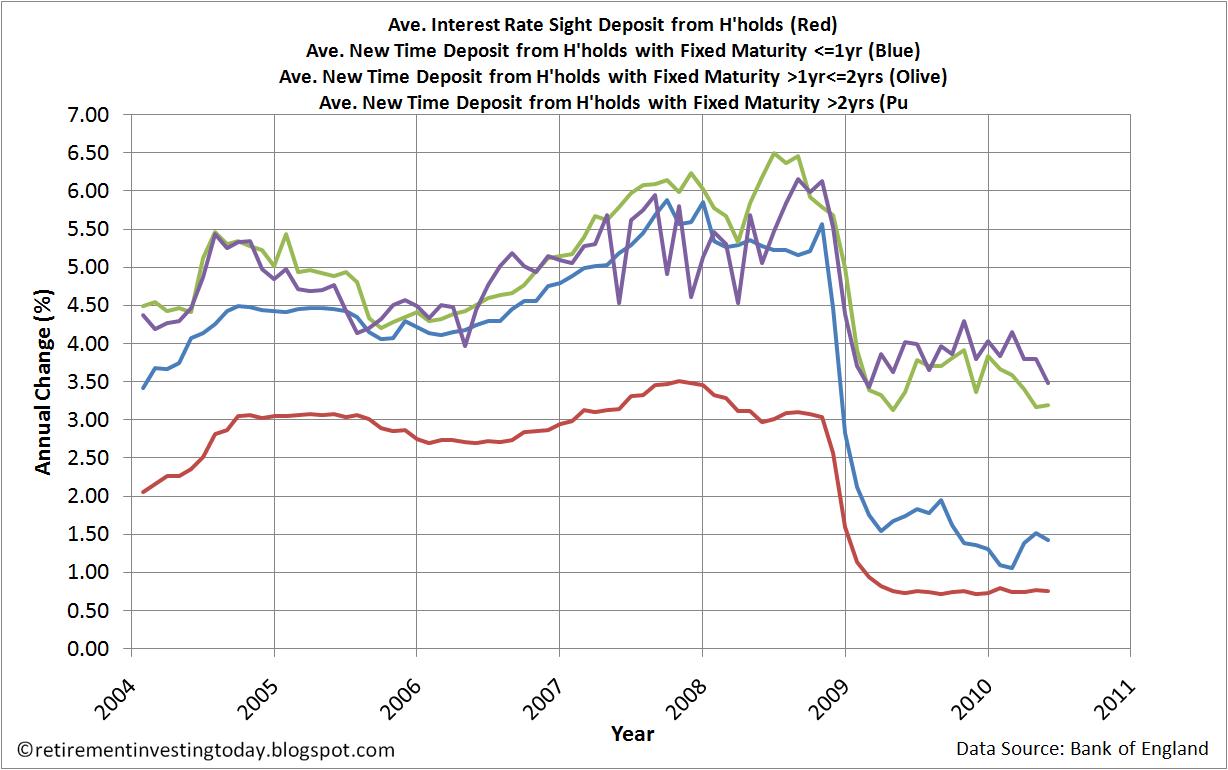
Positive real savings rates are impossible to find - Average UK savings interest rates – July 2010 Update

If you’re a UK saver it remains pretty ugly out there. According to Money saving Expert the top clean rate account pays 2.6% AER however it allows only one penalty free withdrawal a year. That doesn’t sound overly clean to me. If you want unlimited access then you’re looking at 2.5%. With the RPI at 5.0% today, every month you hold your money in one of these accounts you are seeing its purchasing ability eroded.

Tuesday 20 July 2010

The Real Pay Cuts Begin – Average UK Earnings – July 2010 Update

My first chart today shows that as of April 2010 the non seasonally adjusted average earnings index (LNMM) year on year rising by 0.5% and the seasonally adjusted average earnings index (LNMQ) rising by 1.9%. This all sounds great until you look at the inflation figure also shown on the chart which in April 2010 was year on year increasing at 5.3% and today is still increasing at 5.0%.

Monday 19 July 2010

It will always be inflation – UK Inflation – May 2010 Update

I am still reading on blogs and in news articles many discussions on whether going forward we will see inflation or deflation. I might as well wade into the debate and suggest that over the long term (remember I’m a long term investor not a short term trader) I believe that we will see inflation. We could even see hyper inflation. What makes me say this? Well, my first chart showing the UK RPI for starters. It has never failed to reach a new high meaning inflation. Sure we’ve seen some deflation over the short term however I believe that policy makers and governments will just not tolerate deflation as it makes debts larger and savings worth more. Given the debts of governments and individuals this cannot be tolerated. Inflation is the easy way out. I believe that as soon as deflation next appears we’ll see yet more quantitative easing or other drastic measures to try and secure inflation. If they can’t engineer the inflation quickly through moderate means they will continue taking more risks shamelessly until the risk of currency destruction through hyper inflation is upon us. That sound pretty extreme but it is what I feel today.

Sunday 18 July 2010

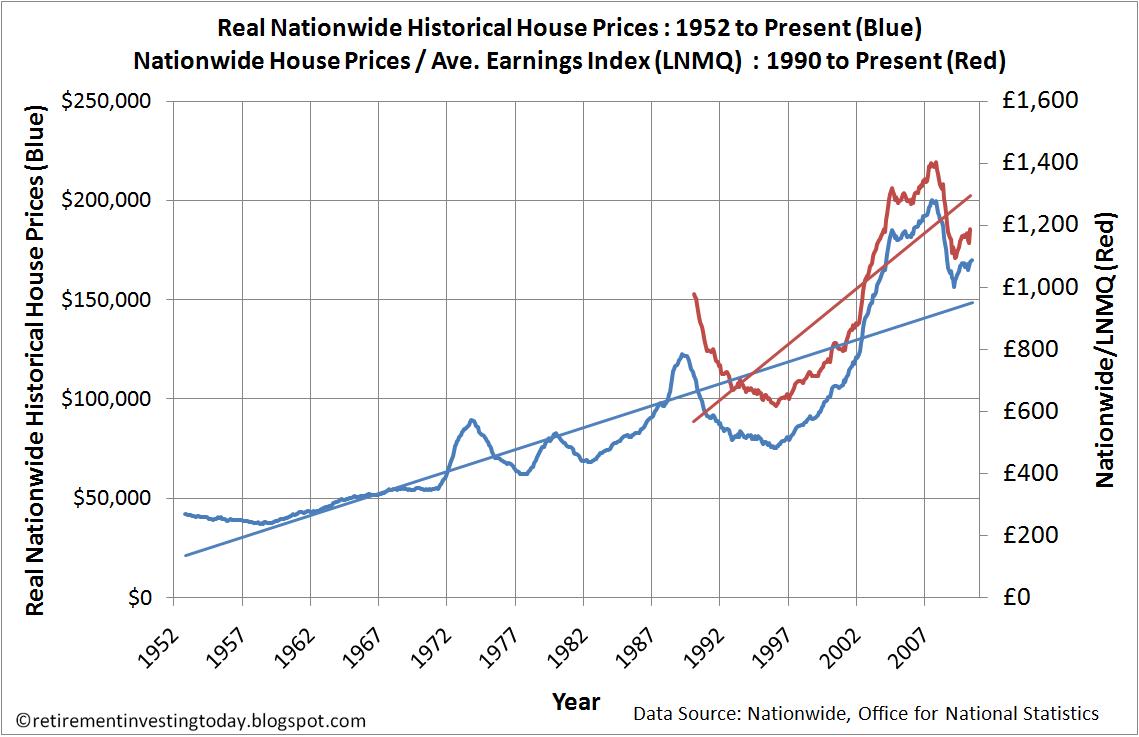
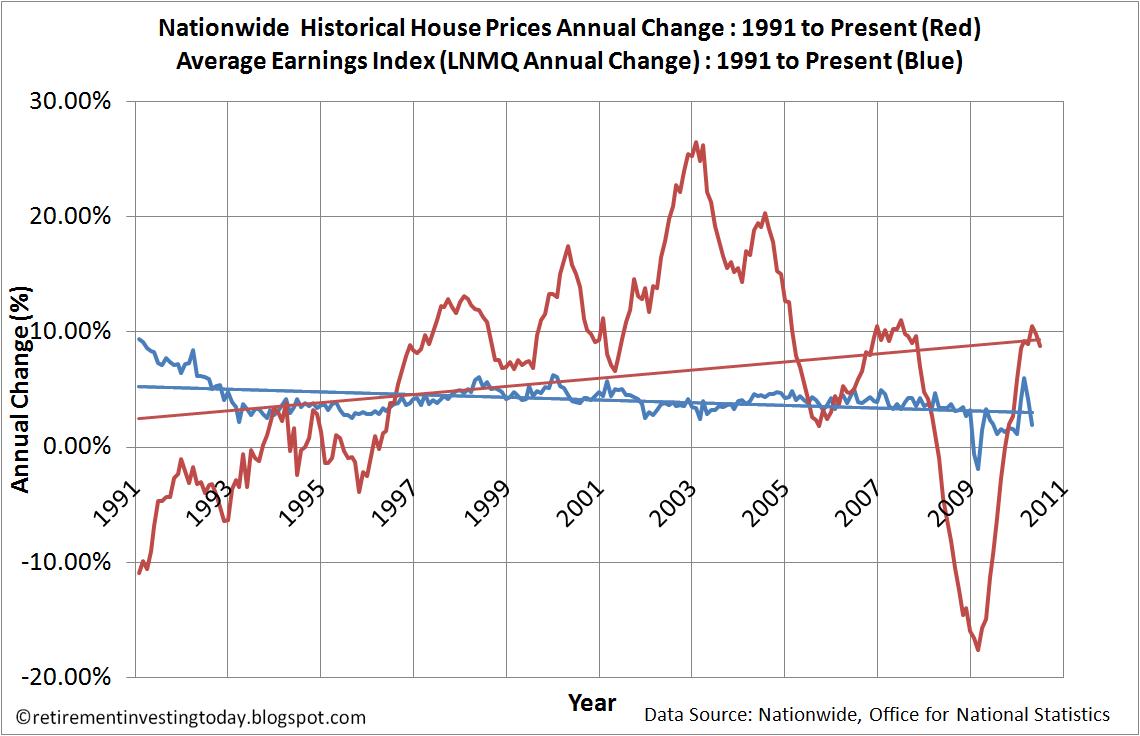
Houses are still overvalued - UK property market – July 2010 Update

The Economist dated July 10th to 16th 2010 has run a very interesting article entitled “Froth and stagnation – House prices in parts of Asia continue to soar, despite efforts to slow them”. As part of this article they present a table showing a list of countries and detail whether according to “The economist house price indicators” houses are under or overvalued. As regular readers will know I am very interested in UK and Australian house prices however let’s have a look at the list from most over valued to most undervalued first: