Thursday 20 May 2010

US Consumer Price Index (CPI) Inflation – April 2010 Update


The above chart shows the US Consumer Price Index (CPI-U) to April 2010 courtesy of the US Bureau of Labor Statistics. Year on year the US CPI inflation index has risen from 213.24 to 218.009 which equates to 2.2% today (down from 2.3% last month). Annualising the last 6 months has inflation at 1.7% and annualising the last 3 months has inflation running at 2.4%.

Wednesday 19 May 2010

UK Inflation – May 2010 Update

The Office for National Statistics has reported the April 2010 UK Consumer Price Index (CPI) as 3.7% up from 3.4% and the UK Retail Price Index (RPI) as 5.3% which is up from 4.4% last month. Regular readers of Retirement Investing Today will I’m sure not be surprised by this at all as the Bank of England have clearly positioned themselves to let inflation run.

Tuesday 18 May 2010

A History of Severe Real S&P 500 Stock Bear Markets – May 2010 Update

Looking at the first chart which shows the real (inflation adjusted) S&P 500 (or its predecessor) stock market I have identified three historic severe stock bear markets. These I am defining as stock markets where from the stock market reaching a new high, they then proceeded to lose in excess of 60% of their real (inflation adjusted) value. These are best demonstrated by the second chart which shows each of these stock bear markets and the fall in percentage terms from the peak. So briefly what were these bear markets (full details here).

Monday 17 May 2010

US (S&P 500) stock market including the cyclically adjusted price earnings ratio (PE10 or CAPE) – May 2010 Update

To try and squeeze some more performance out of a retirement investing strategy that is heavily focused on buy & hold and asset allocation I am using a Cyclically Adjusted Price / Average 10 Year Earnings (PE10 or CAPE) ratio for the S&P 500 to value the US (specifically the S&P 500) stock market. The method used is that developed by Yale Professor Robert Shiller however I also incorporate earnings estimates up to the PE10 month of interest. Background information here.

Sunday 16 May 2010

GDP per capita – BRIC vs PIGS vs UK, USA, Germany

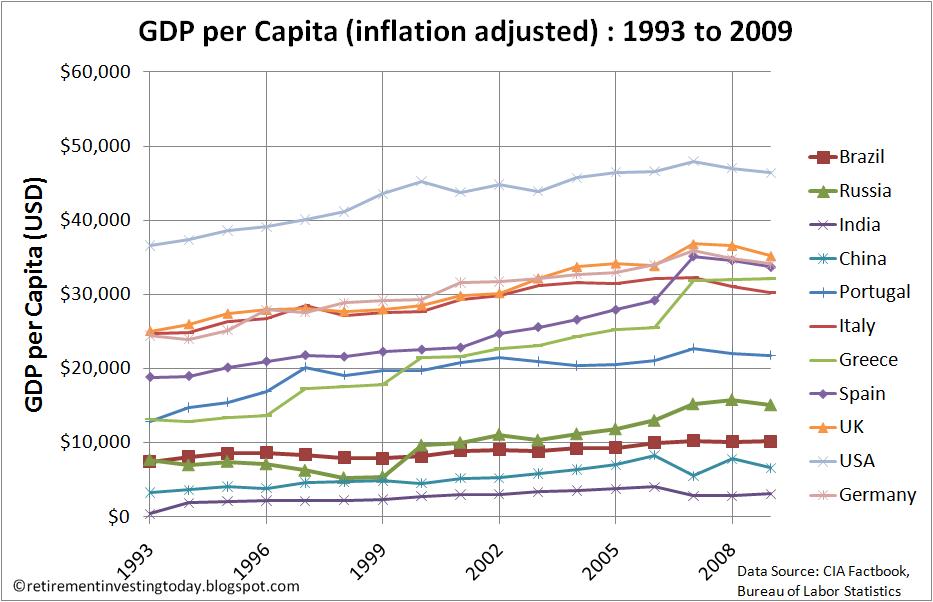
We hear every day about the gross domestic product (or GDP) of countries. For example, it is always seen as negative if GDP is decreasing (by definition the UK enters a recession if there are 2 quarters of negative GDP) and positive if GDP is increasing. For the Average Joe on the street though I think GDP is not as important as GDP per capita which just doesn’t seem to ever discussed in the media or by government. For example:
- In an extreme I think if GDP started to fall but the population (through migration for example) fell at a faster rate then it is very possible that a person’s standard of living could actually be increasing. This is because the average persons GDP per capita would be increasing meaning that they should also be increasing their salary.