I’d like to again welcome back John Hulton. John claims to not be a financial guru, stockbroker or financial journalist, but just an average bloke who has managed to find a way through the minefields of personal finance and develop a system that works for him and, which could be helpful for other people. He has already retired from full time work which puts him at the end game of what this Site is about – Save Hard, Invest Wisely, Retire Early. So while John is not a financial expert his approach has given him what many of us are chasing. I hope you again enjoy his thoughts.
The FTSE 100 got off to a flying start in 2013, the best January rise since 1989! The markets rose above 6,300, a price last seen prior to the start of the sovereign debt crisis in 2008.
How long this surge will continue nobody can know. Is it a temporary spike or is it a sign that the economies around the world are starting to see signs of real recovery? There will be much speculation in the media and on the discussion boards.
At one time, earlier in my investing career, I would probably have been thinking about selling some of the shares which had risen strongly. I would be trying to second-guess the market - there is no justification for this rise - all the problems of systemic debt in the major industrialised countries have not suddenly disappeared - the markets will soon fall back towards 5,000 and I will keep my powder dry and pick up a few bargains later in the year.
I say ‘at one time’ but I’m sure there’s still a bit of me that thinks the same way now. However, the emotional factors which underlie that process are basically twofold - fear and greed. Fear the markets may suddenly swing down as quickly as they have risen and I will lose all the double digit gains on my portfolio - and the greed of selling high and buying low during the next downturn. These two bedfellows are always present but need to be understood and neutralised if you wish to invest for the long term.
After many years as a private investor, I am gradually learning to regard these market swings and share price fluctuations with an attitude of mildly detached interest. I really don’t get over-excited when markets rise and equally, I don’t become wracked with fear when markets are falling. As an income investor, it will probably suit me when markets are in decline as it will throw up many more opportunities for a decent yield.
On a day to day basis, most investors will probably be following share prices because this is where all the action is. Profits are made on the markets by buying at a low price and selling at a high price, right? Wrong! Over the longer term, up to 90% of the total return on your portfolio will be derived from dividends - growth of dividends and especially the reinvesting of dividends.

Showing posts with label stock market. Show all posts
Showing posts with label stock market. Show all posts
Thursday 14 February 2013
Tuesday 12 February 2013
The FTSE 100 Cyclically Adjusted PE Ratio (FTSE 100 CAPE or PE10) – February 2013 Update
This is the Retirement Investing Today monthly update for the FTSE 100 Cyclically Adjusted PE (FTSE 100 CAPE). Last month’s update can be found here.
As always before we look at the CAPE let us first look at other key FTSE 100 metrics:
So we find ourselves in an interesting situation. Nominal Earnings are falling and have been consistently since October 2011’s Earnings of 628 yet Prices are rising.
The first chart below provides a historic view of the Real (CPI adjusted) FTSE 100 Price and the Real FTSE 100 P/E. Look at the trend line of the Real Price. After you strip out the effects of inflation the perceived market value is doing not much more than oscillating above and below a flat line which we are now sitting on. The second chart provides a historic view of the Real Earnings along with a rolling Real 10 Year Earnings Average for the FTSE 100.


As always before we look at the CAPE let us first look at other key FTSE 100 metrics:
- The FTSE 100 Price is currently 6,338 which is a gain of 5.2% on the 01 January 2013 Price of 6,027 and 9.5% above the 01 February 2012 Price of 5,791.
- The FTSE 100 Dividend Yield is currently 3.47% which is down against the 01 January 2013 yield of 3.64%.
- The FTSE 100 Price to Earnings (P/E) Ratio is currently 12.96.
- The Price and the P/E Ratio allows us to calculate the FTSE 100 As Reported Earnings (which are the last reported year’s earnings and are made up of the sum of the latest two half years earnings) as 489. They are down 4.6% month on month and down 11.7% year on year. The Earnings Yield is therefore 7.7%.
So we find ourselves in an interesting situation. Nominal Earnings are falling and have been consistently since October 2011’s Earnings of 628 yet Prices are rising.
The first chart below provides a historic view of the Real (CPI adjusted) FTSE 100 Price and the Real FTSE 100 P/E. Look at the trend line of the Real Price. After you strip out the effects of inflation the perceived market value is doing not much more than oscillating above and below a flat line which we are now sitting on. The second chart provides a historic view of the Real Earnings along with a rolling Real 10 Year Earnings Average for the FTSE 100.

Click to enlarge

Click to enlarge
Monday 4 February 2013
The S&P 500 Cyclically Adjusted PE (aka S&P 500 or Shiller PE10 or CAPE) – February 2013 Update
The US stock market has seen some large gains since New Year’s Eve. As I write this post the mid market price for the S&P500 is down 0.9% on the day at 1,499.8 but still up 5.2% in little over a month. Similarly, the Dow Jones is down 0.8% at 13,903.5 but is up 6.1% since the market close on the 31 December 2012. It’s therefore appropriate to run the standard Retirement Investing Today monthly update for the S&P500 Cyclically Adjusted PE (S&P 500 CAPE). Let’s see if the market is just exuberant or starting to head towards Irrational Exuberance . Last month’s update can be found here.
As usual before we look at the CAPE let us first look at other key S&P 500 metrics:
The first chart below provides a historic view of the Real (inflation adjusted) S&P 500 Price and the S&P 500 P/E. The second chart below provides a historic view of the Real (after inflation) Earnings and Real (after inflation) Dividends for the S&P 500.


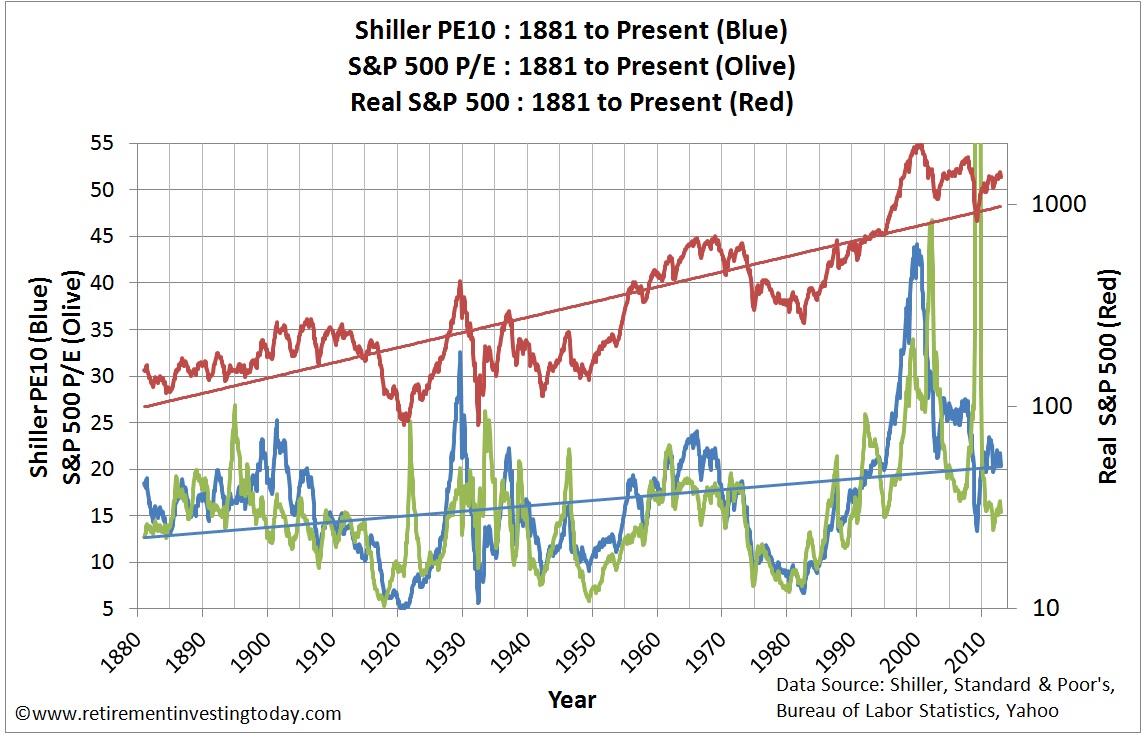
As always let us now turn our attention to the metric that this post is interested in which is the Shiller PE10. This is also shown in the first chart which dates back to 1881 and is effectively an S&P 500 cyclically adjusted PE or CAPE for short. This method is used and was made famous by Professor Robert Shiller. It is simply the ratio of Real (ie after inflation) S&P 500 Monthly Prices to 10 Year Real (ie after inflation) Average Earnings.
As usual before we look at the CAPE let us first look at other key S&P 500 metrics:
- The S&P 500 Price is currently 1,500 which is a rise of 1.3% on last month’s average close of 1,480 and 13.3% above this time last year’s monthly Price of 1,324.
- The S&P 500 Dividend Yield is currently 2.1%.
- The S&P As Reported Earnings (using a combination of actual and estimated earnings) are currently $88.85 for an Earnings Yield of 5.9%.
- The S&P 500 P/E Ratio is currently 16.9 which is up from last month’s 16.8.
The first chart below provides a historic view of the Real (inflation adjusted) S&P 500 Price and the S&P 500 P/E. The second chart below provides a historic view of the Real (after inflation) Earnings and Real (after inflation) Dividends for the S&P 500.

Click to enlarge

Click to enlarge
As always let us now turn our attention to the metric that this post is interested in which is the Shiller PE10. This is also shown in the first chart which dates back to 1881 and is effectively an S&P 500 cyclically adjusted PE or CAPE for short. This method is used and was made famous by Professor Robert Shiller. It is simply the ratio of Real (ie after inflation) S&P 500 Monthly Prices to 10 Year Real (ie after inflation) Average Earnings.
Wednesday 16 January 2013
The FTSE 100 Cyclically Adjusted PE Ratio (FTSE 100 CAPE or PE10) – January 2013 Update
This is the Retirement Investing Today monthly update for the FTSE 100 Cyclically Adjusted PE (FTSE 100 CAPE). Last month’s update can be found here.
As always before we look at the CAPE let us first look at other key FTSE 100 metrics:
The first chart below provides a historic view of the Real (CPI adjusted) FTSE 100 Price and the Real FTSE 100 P/E. Look at the trend line of the Real Price. After you strip out the effects of inflation the perceived market value is doing not much more than oscillating above and below a flat line. This then presents a problem for any buy and holder reinforcing the importance of dividends. The second chart provides a historic view of the Real Earnings along with a rolling Real 10 Year Earnings Average for the FTSE 100.


As always let us now turn our attention to the FTSE 100 Cyclically Adjusted PE. This is also shown in the first chart above. For completeness let me also detail the usual reminders. I do not use P/E ratio’s to make investment decisions from and instead use this CAPE. This is because the P/E ratio does not take the business cycle into account which the CAPE tries to adjust for. The method used is similar to that developed by Professor Robert Shiller for the S&P500. The calculation is the ratio of Real (ie after inflation) FTSE 100 first possible day of the month Price to the 10 Year Real (CPI adjusted) first possible day of the month Earnings. Unfortunately the dataset I have created only goes back to July 1993. Therefore to get a meaningful set of numbers I have had to average in to a PE10 for the first 10 years. What this means is that July 1994 is actually a PE1, July 1995 is a PE2 and so forth until July 2003 when we have a full FTSE 100 PE10.
As always before we look at the CAPE let us first look at other key FTSE 100 metrics:
- The FTSE 100 Price is currently 6,104 which is a gain of 4.0% on the 03 December 2012 Price of 5,871 and 7.1% above the 02 January 2012 Price of 5,700.
- The FTSE 100 Dividend Yield is currently 3.64% which is a little down against the 03 December 2013 yield of 3.73%.
- The FTSE 100 Price to Earnings (P/E) Ratio is currently 11.78.
- The Price and the P/E Ratio allows us to calculate the FTSE 100 As Reported Earnings (which are the last reported year’s earnings and are made up of the sum of the latest two half years earnings) as 518. They are up 1.1% month on month but down 6.5% year on year. The Earnings Yield is therefore 8.5%.
The first chart below provides a historic view of the Real (CPI adjusted) FTSE 100 Price and the Real FTSE 100 P/E. Look at the trend line of the Real Price. After you strip out the effects of inflation the perceived market value is doing not much more than oscillating above and below a flat line. This then presents a problem for any buy and holder reinforcing the importance of dividends. The second chart provides a historic view of the Real Earnings along with a rolling Real 10 Year Earnings Average for the FTSE 100.

Click to enlarge

Click to enlarge
As always let us now turn our attention to the FTSE 100 Cyclically Adjusted PE. This is also shown in the first chart above. For completeness let me also detail the usual reminders. I do not use P/E ratio’s to make investment decisions from and instead use this CAPE. This is because the P/E ratio does not take the business cycle into account which the CAPE tries to adjust for. The method used is similar to that developed by Professor Robert Shiller for the S&P500. The calculation is the ratio of Real (ie after inflation) FTSE 100 first possible day of the month Price to the 10 Year Real (CPI adjusted) first possible day of the month Earnings. Unfortunately the dataset I have created only goes back to July 1993. Therefore to get a meaningful set of numbers I have had to average in to a PE10 for the first 10 years. What this means is that July 1994 is actually a PE1, July 1995 is a PE2 and so forth until July 2003 when we have a full FTSE 100 PE10.
Sunday 13 January 2013
The ASX 200 Cyclically Adjusted PE (aka ASX 200 PE10 or ASX200 CAPE) – January 2013 Update
This is the Retirement Investing Today monthly update for the Australian ASX 200 Cyclically Adjusted PE (ASX 200 CAPE). The last update can be found here.
Before we run the CAPE analysis let us first look at some of the key Australian Stock Market metrics:
The first chart today shows a historic view of the Real (inflation adjusted) ASX 200 Price and the ASX 200 P/E. The second chart provides a historic view of the Real (after inflation) Earnings and the Real (after inflation) Dividends for the ASX 200.
, the ASX200 PE and the Real ASX200 Price")

Before we run the CAPE analysis let us first look at some of the key Australian Stock Market metrics:
- The ASX 200 Price at market close on Friday was 4,709 which is up 1.3% from last month’s Price of 4,649 and up 10.5% year on year.
- The MSCI Australia Dividend Yield is currently 4.6%. I accept this Index as an ASX200 proxy for both Dividend Yield and P/E Ratio based on this analysis.
- The ASX 200 Earnings (calculated using MSCI Australia P/E Ratio and ASX 200 Price) are currently 304. This gives an Earnings Yield of 6.5%.
- The MSCI Australia P/E Ratio is currently 15.5 compared with the dataset (since December 1982) average P/E of 18.3
The first chart today shows a historic view of the Real (inflation adjusted) ASX 200 Price and the ASX 200 P/E. The second chart provides a historic view of the Real (after inflation) Earnings and the Real (after inflation) Dividends for the ASX 200.
, the ASX200 PE and the Real ASX200 Price")
Click to enlarge

Click to enlarge
Wednesday 9 January 2013
The S&P 500 Cyclically Adjusted PE (aka S&P 500 or Shiller PE10 or CAPE) – January 2013 Update
This is the Retirement Investing Today monthly update for the S&P500 Cyclically Adjusted PE (S&P 500 CAPE). Last month’s update can be found here.
As usual before we look at the CAPE let us first look at other key S&P 500 metrics:
The first chart below provides a historic view of the Real (inflation adjusted) S&P 500 Price and the S&P 500 P/E. The second chart below provides a historic view of the Real (after inflation) Earnings and Real (after inflation) Dividends for the S&P 500.


As always let us now turn our attention to the metric that this post is interested in which is the Shiller PE10. This is also shown in the first chart which dates back to 1881 and is effectively an S&P 500 cyclically adjusted PE or CAPE for short. This method is used and was made famous by Professor Robert Shiller. It is simply the ratio of Real (ie after inflation) S&P 500 Monthly Prices to 10 Year Real (ie after inflation) Average Earnings.
It is important to highlight that my calculation method varies from that of Professor Shiller. He only uses S&P 500 Actual Earnings data where because I use the S&P 500 PE10 to actually make investment decisions from I also include extrapolated Earnings estimates right up to the present day. This is to try and make the value as current as possible.
As usual before we look at the CAPE let us first look at other key S&P 500 metrics:
- The S&P 500 Price is currently 1,461 which is a rise of 2.7% on last month’s Price of 1,422 and 12.3% above this time last year’s monthly Price of 1,301.
- The S&P 500 Dividend Yield is currently 2.1%.
- The S&P As Reported Earnings (using a combination of actual and estimated earnings) are currently $87.55 for an Earnings Yield of 6.0%.
- The S&P 500 P/E Ratio is currently 16.7 which is up from last month’s 16.3.
The first chart below provides a historic view of the Real (inflation adjusted) S&P 500 Price and the S&P 500 P/E. The second chart below provides a historic view of the Real (after inflation) Earnings and Real (after inflation) Dividends for the S&P 500.

Click to enlarge

Click to enlarge
As always let us now turn our attention to the metric that this post is interested in which is the Shiller PE10. This is also shown in the first chart which dates back to 1881 and is effectively an S&P 500 cyclically adjusted PE or CAPE for short. This method is used and was made famous by Professor Robert Shiller. It is simply the ratio of Real (ie after inflation) S&P 500 Monthly Prices to 10 Year Real (ie after inflation) Average Earnings.
It is important to highlight that my calculation method varies from that of Professor Shiller. He only uses S&P 500 Actual Earnings data where because I use the S&P 500 PE10 to actually make investment decisions from I also include extrapolated Earnings estimates right up to the present day. This is to try and make the value as current as possible.
Saturday 5 January 2013
The Fiscal Cliff and Severe Real S&P500 Bear Markets – January 2013 Update
With the US Government this week deciding that it was going to make no attempt to at least start the country along the road towards living within its means, the so called Fiscal Cliff was avoided. In response the S&P500 rose 4.0% in the week to close at 1,466. While the main stream media were getting all excited about this increase I started to think about how this continual kicking of the can down the road could actually be storing up future problems, which might actually prolong the Severe Real S&P500 Bear Market I believe we may still find ourselves within. I last posted about this analysis in September 2012. As a reminder I define a Severe S&P500 Bear Market as a period in time where from the stock market reaching a new Real (inflation adjusted) high it then proceeded to lose in excess of 60% of its real Value.
The previous Severe Real S&P500 Bear Markets are revealed in the chart below which corrects historic S&P500 Prices since 1881 by the devaluation of the US Dollar to arrive at Real Prices. This chart shows we are now back to Prices last seen in March 1998 and also shows we have seen three previous Severe Real Bear Markets.

If I think of the US Government putting off this unpopular decision for another day then at some time in the future the bond market may force them to make a decision. Of course at that time they will then have somebody else to blame which will suit the weak politicians whose only focus seems to be to get themselves re-elected. The subsequent rise in taxes and cuts to spending which would then follow would then have to be worse than they were faced with today because through indecision they have made the problem a larger one to solve. The S&P 500 may then respond with a big fall which brings me back to the chart above. Now there is of course a risk that I’ve been looking at this chart too long however I can generally see in the last 3 Severe Bear Markets two lower Real highs following the initial new Real high. From this second lower Real high we then see Real Prices fall between 40 and 60%. Are we are nearing that second lower high and could this government indecision actually end up causing this next big leg down? Of course I would never buy or sell based on this hypothesis because the market can remain irrational far longer than I can remain solvent.
If I overlay the three Severe S&P Bear Markets with today’s market by comparing the percentage change in value from the peak for each of these periods we arrive at today’s second chart. So what were these previous bear markets?

The previous Severe Real S&P500 Bear Markets are revealed in the chart below which corrects historic S&P500 Prices since 1881 by the devaluation of the US Dollar to arrive at Real Prices. This chart shows we are now back to Prices last seen in March 1998 and also shows we have seen three previous Severe Real Bear Markets.

Click to enlarge
If I think of the US Government putting off this unpopular decision for another day then at some time in the future the bond market may force them to make a decision. Of course at that time they will then have somebody else to blame which will suit the weak politicians whose only focus seems to be to get themselves re-elected. The subsequent rise in taxes and cuts to spending which would then follow would then have to be worse than they were faced with today because through indecision they have made the problem a larger one to solve. The S&P 500 may then respond with a big fall which brings me back to the chart above. Now there is of course a risk that I’ve been looking at this chart too long however I can generally see in the last 3 Severe Bear Markets two lower Real highs following the initial new Real high. From this second lower Real high we then see Real Prices fall between 40 and 60%. Are we are nearing that second lower high and could this government indecision actually end up causing this next big leg down? Of course I would never buy or sell based on this hypothesis because the market can remain irrational far longer than I can remain solvent.
If I overlay the three Severe S&P Bear Markets with today’s market by comparing the percentage change in value from the peak for each of these periods we arrive at today’s second chart. So what were these previous bear markets?

Click to enlarge
Thursday 20 December 2012
The FTSE 100 Cyclically Adjusted PE Ratio (FTSE 100 CAPE or PE10) – December 2012 Update
This is the Retirement Investing Today monthly update for the FTSE 100 Cyclically Adjusted PE (FTSE 100 CAPE). Last month’s update can be found here.
As always before we look at the CAPE let us first look at other key FTSE 100 metrics:
The first chart below provides a historic view of the Real (CPI adjusted) FTSE 100 Price and the Real FTSE 100 P/E. The second chart provides a historic view of the Real Earnings along with a rolling Real 10 Year Earnings Average for the FTSE 100.


As always before we look at the CAPE let us first look at other key FTSE 100 metrics:
- The FTSE 100 mid market Price is currently 5,960 which is a gain of 1.7% on the 01 November 2012 Price of 5,862 and 8.6% above the 01 December 2011 Price of 5,489.
- The FTSE 100 Dividend Yield is currently 3.73% which is flat against the 01 November 2012 yield of 3.71%.
- The FTSE 100 Price to Earnings (P/E) Ratio is currently 11.46.
- The Price and the P/E Ratio allows us to calculate the FTSE 100 As Reported Earnings (which are the last reported year’s earnings and are made up of the sum of the latest two half years earnings) as 520. They are up 1.2% month on month and down 7.1% year on year. The Earnings Yield is therefore 8.7%.
The first chart below provides a historic view of the Real (CPI adjusted) FTSE 100 Price and the Real FTSE 100 P/E. The second chart provides a historic view of the Real Earnings along with a rolling Real 10 Year Earnings Average for the FTSE 100.

Click to enlarge

Click to enlarge
Thursday 13 December 2012
The S&P 500 Cyclically Adjusted PE (aka S&P 500 or Shiller PE10 or CAPE) – December 2012 Update
This is the Retirement Investing Today monthly update for the S&P500 Cyclically Adjusted PE (S&P 500 CAPE). Last month’s update can be found here.
As usual before we look at the CAPE let us first look at other key S&P 500 metrics:
")

As usual before we look at the CAPE let us first look at other key S&P 500 metrics:
- The S&P 500 Price is currently 1,417 which is a rise of 1.6% on last month’s Price of 1,395 and 14.0% above this time last year’s monthly Price of 1,243.
- The S&P 500 Dividend Yield is currently 2.1%.
- The S&P As Reported Earnings (using a combination of actual and estimated earnings) are currently $87.77 for an Earnings Yield of 6.2%.
- The S&P 500 P/E Ratio is currently 16.1 which is down from last month’s 16.0.
")
Click to enlarge

Click to enlarge
Sunday 25 November 2012
The FTSE 100 Cyclically Adjusted PE Ratio (FTSE 100 CAPE or PE10) – November 2012 Update
This is the Retirement Investing Today monthly update for the FTSE 100 Cyclically Adjusted PE (FTSE 100 CAPE). Last month’s update can be found here.
As always before we look at the CAPE let us first look at other key FTSE 100 metrics:
As always before we look at the CAPE let us first look at other key FTSE 100 metrics:
- The FTSE 100 Price is currently 5,819 which is flat against the 01 October 2012 Price of 5,820 and 7.3% above the 01 November 2011 Price of 5,422.
- The FTSE 100 Dividend Yield is currently 3.71% which is also flat against the 01 October 2012 yield of 3.72%.
- The FTSE 100 Price to Earnings (P/E) Ratio is currently 11.41.
- The Price and the P/E Ratio allows us to calculate the FTSE 100 As Reported Earnings (which are the last reported year’s earnings and are made up of the sum of the latest two half years earnings) as 510. They are down 1.0% month on month and down 7.9 year on year. The Earnings Yield is therefore 8.8%.
Saturday 17 November 2012
The S&P 500 Cyclically Adjusted PE (aka S&P 500 or Shiller PE10 or CAPE) – November 2012 Update
This is the Retirement Investing Today monthly update for the S&P500 Cyclically Adjusted PE (S&P 500 CAPE). Last month’s update can be found here.
As usual before we look at the CAPE let us first look at other key S&P 500 metrics:
The first chart below provides a historic view of the Real (inflation adjusted) S&P 500 Price and the S&P 500 P/E. The second chart provides a historic view of the Real (after inflation) Earnings and Real (after inflation) Dividends for the S&P 500.
As usual before we look at the CAPE let us first look at other key S&P 500 metrics:
- The S&P 500 Price is currently 1,360 which is a fall of 5.4% on last month’s Price of 1,438 and 10.9% above this time last year’s Price of 1,226.
- The S&P 500 Dividend Yield is currently 2.2%.
- The S&P As Reported Earnings (using a combination of actual and estimated earnings) are currently $88.20 for an Earnings Yield of 6.5%.
- The S&P 500 P/E Ratio is currently 15.4 which is down from last month’s 16.4.
The first chart below provides a historic view of the Real (inflation adjusted) S&P 500 Price and the S&P 500 P/E. The second chart provides a historic view of the Real (after inflation) Earnings and Real (after inflation) Dividends for the S&P 500.

Click to enlarge
Wednesday 24 October 2012
The ASX 200 Cyclically Adjusted PE (aka ASX 200 PE10 or ASX200 CAPE) – October 2012 Update
This is the Retirement Investing Today monthly update for the Australian ASX 200 Cyclically Adjusted PE (ASX 200 CAPE). The last update can be found here.
Before we run the analysis we need to discuss an anomaly with the dataset that has been built over many years. The dataset is calculated using data published by the Reserve Bank of Australia. I show a screen grab of this data below. Reading this table I have always assumed that the columns “Dividend yield per cent per annum” and “Price/Earnings ratio” referred to the ASX200. It turns out that this was a bad assumption and this month I have noticed some small print that highlights that these two columns actually refer to the MSCI Australia Index with all other columns being the ASX200. This to me is just bizarre but if we want to continue with this dataset it looks like I am going to have to think outside the box as I’ve tried searching for new data that details the P/E and Dividend Yield of the ASX200 and not surprisingly drawn a blank.

Before we run the analysis we need to discuss an anomaly with the dataset that has been built over many years. The dataset is calculated using data published by the Reserve Bank of Australia. I show a screen grab of this data below. Reading this table I have always assumed that the columns “Dividend yield per cent per annum” and “Price/Earnings ratio” referred to the ASX200. It turns out that this was a bad assumption and this month I have noticed some small print that highlights that these two columns actually refer to the MSCI Australia Index with all other columns being the ASX200. This to me is just bizarre but if we want to continue with this dataset it looks like I am going to have to think outside the box as I’ve tried searching for new data that details the P/E and Dividend Yield of the ASX200 and not surprisingly drawn a blank.

Click to enlarge
Wednesday 17 October 2012
The FTSE 100 Cyclically Adjusted PE Ratio (FTSE 100 CAPE or PE10) – October 2012 Update
This is the Retirement Investing Today monthly update for the FTSE 100 Cyclically Adjusted PE (FTSE 100 CAPE). Last month’s update can be found here.
As always before we look at the CAPE let us first look at other key FTSE 100 metrics:
As always before we look at the CAPE let us first look at other key FTSE 100 metrics:
- The FTSE 100 Price is currently 5,911 which is 2.6% above the 03 September 2012 Price of 5,758 and 16.5% above the 03 October 2011 Price of 5,076.
- The FTSE 100 Dividend Yield is currently 3.70% which is a slight fall from the 03 September 2012 yield of 3.75%.
- The FTSE 100 Price to Earnings (P/E) Ratio is currently 11.43.
- The Price and the P/E Ratio allows us to calculate the FTSE 100 As Reported Earnings (which are the last reported year’s earnings and are made up of the sum of the latest two half years earnings) as 517. They are up 2.3% month on month and down 17.7% year on year. The Earnings Yield is therefore 8.7%.
Thursday 11 October 2012
The S&P 500 Cyclically Adjusted PE (aka S&P 500 or Shiller PE10 or CAPE) – October 2012 Update
This is the Retirement Investing Today monthly update for the S&P500 Cyclically Adjusted PE (S&P 500 CAPE). Last month’s update can be found here.
As usual before we look at the CAPE let us first look at other key S&P 500 metrics:
As usual before we look at the CAPE let us first look at other key S&P 500 metrics:
- The S&P 500 Price is currently 1,435 which is 0.6% below last month’s Price of 1,443 and 18.8% above this time last year’s Price of 1,207.
- The S&P 500 Dividend Yield is currently 1.97%.
- The S&P As Reported Earnings (using a combination of actual and estimated earnings) are currently $88.87 for an Earnings Yield of 6.2%.
- The S&P 500 P/E Ratio is currently 16.2 which is down from last month’s 16.3.
Sunday 23 September 2012
The Dow has not reached 5 year highs (Severe Real S&P500 Bear Markets) – September 2012
I admit that over the past few weeks the US stock market has been a little bullish and has put on some good short term gains. I however have not been excited by what I have been seeing. The press however seem to be exactly the opposite. We’ve seen headlines like Dow Closes at 5-year high, Market milestone: Stocks return to late 2007 level and even the US version of The Motley Fool telling us How the Dow reached a 5-year high.
It really is unfortunate that we live in an era where not even the press feel the need to report facts and can get away with such sloppy journalism. Firstly, in nominal terms the Dow Jones Industrial Average (DJIA) has not reached a 5 year high. According to Google Finance within the last 5 years in nominal terms the best DJIA close we have seen has been 14,164 on the 09 October 2007. In comparison in this recent bull market the best close we have seen has been 13,596 on the 20 September 2012. I make that a gap of 4.0% so not what I would call a high. The full 5 year story can be seen in my first chart which comes from Yahoo Finance.

It really is unfortunate that we live in an era where not even the press feel the need to report facts and can get away with such sloppy journalism. Firstly, in nominal terms the Dow Jones Industrial Average (DJIA) has not reached a 5 year high. According to Google Finance within the last 5 years in nominal terms the best DJIA close we have seen has been 14,164 on the 09 October 2007. In comparison in this recent bull market the best close we have seen has been 13,596 on the 20 September 2012. I make that a gap of 4.0% so not what I would call a high. The full 5 year story can be seen in my first chart which comes from Yahoo Finance.

5 Year Nominal DJIA Chart (Click to enlarge)
Wednesday 12 September 2012
The FTSE 100 Cyclically Adjusted PE Ratio (FTSE 100 CAPE or PE10) – September 2012 Update
This is the Retirement Investing Today monthly update for the FTSE 100 Cyclically Adjusted PE (FTSE 100 CAPE). Last month’s update can be found here.
As always before we look at the CAPE let us first look at other key FTSE 100 metrics:
As always before we look at the CAPE let us first look at other key FTSE 100 metrics:
- The FTSE 100 Price is currently 5,782 which is a 1.2% above the 01 August 2012 Price of 5,712 and 6.7% above the 01 September 2011 Price of 5,419.
- The FTSE 100 Dividend Yield is currently 3.74% which is a slight rise from the 01 August 2012 yield of 3.71%.
- The FTSE 100 Price to Earnings (P/E) Ratio is currently 11.46 which is up 6.2% since the 01 August 2012 and 32.5% since the 01 September 2011.
- The Price and the P/E Ratio allows us to calculate the FTSE 100 As Reported Earnings (which are the last reported year’s earnings and are made up of the sum of the latest two half years earnings) as 504. Earnings are continuing to fall while Prices continue to rise. They are down 4.7% month on month and down 19.5% year on year.
Thursday 6 September 2012
The S&P 500 Cyclically Adjusted PE (aka S&P 500 or Shiller PE10 or CAPE) – September 2012 Update
Stock markets today provided big rises after Mario Draghi announced that he plans to buy up the debt of his favourite PIGS. The German DAX rose 2.9%, France’s CAC 40 rose 3.1%, the UK’s FTSE 100 was up 2.1% and the Spanish IBEX was up a large 4.9%. Positive market responses were not limited to Europe with the US S&P 500 also up 1.9% as I write this post.
Given these market moves let’s look at the Retirement Investing Today monthly update for the S&P500 Cyclically Adjusted PE (S&P 500 CAPE). Last month’s update can be found here.
Before we look at the CAPE let us first look at other key S&P 500 metrics:
Given these market moves let’s look at the Retirement Investing Today monthly update for the S&P500 Cyclically Adjusted PE (S&P 500 CAPE). Last month’s update can be found here.
Before we look at the CAPE let us first look at other key S&P 500 metrics:
- The S&P 500 Price is currently 1,430 which is 1.9% above last month’s Price of 1,403 and 21.8% above this time last year’s Price of 1,174.
- The S&P 500 Dividend Yield is currently 1.98%.
- The S&P As Reported Earnings (using a combination of actual and estimated earnings) are currently $88.59 for an Earnings Yield of 6.2%.
- The S&P 500 P/E Ratio is currently 16.1 which is up from last month’s 15.9.
Thursday 16 August 2012
The FTSE 100 Cyclically Adjusted PE Ratio (FTSE 100 CAPE or PE10) – August 2012 Update
This is the Retirement Investing Today monthly update for the FTSE 100 Cyclically Adjusted PE (FTSE 100 CAPE). Last month’s update can be found here.
As always before we look at the CAPE let us first look at other key FTSE 100 metrics:
As always before we look at the CAPE let us first look at other key FTSE 100 metrics:
- The FTSE 100 Price is currently 5,835 which is a 3.4% above the 01 July 2012 Price of 5,641 and 13.7% above the 01 August 2011 Price of 5,130.
- The FTSE 100 Dividend Yield is currently 3.69% having fallen back from 3.75% on the 01 July 2012.
- The FTSE 100 Price to Earnings (P/E) Ratio is currently 11.23 which is up 10.7% since the 01 July 2012 and 19.3% since the 01 August 2011.
- The Price and the P/E Ratio allows us to calculate the FTSE 100 As Reported Earnings (which are the last reported year’s earnings and are made up of the sum of the latest two half years earnings) as 520. Of concern is that Earnings in nominal terms now seem to be falling with them down 6.6% since the 01 July 2012 and down 4.7% since the 01 August 2011.
Sunday 12 August 2012
The S&P 500 Cyclically Adjusted PE (aka S&P 500 or Shiller PE10 or CAPE) – August 2012 Update
Before we look at the CAPE let us first look at other key S&P 500 metrics:
- The S&P 500 Price is currently 1,406 which is 3.4% above last month’s Price of 1,360 and 18.6% above this time last year’s Price of 1,185.
- The S&P 500 Dividend Yield is currently 2.01%.
- The S&P As Reported Earnings (using a combination of actual and estimated earnings) are currently $90.02.
- The S&P 500 P/E Ratio is currently 15.6 which is up from last month’s 15.2.
Saturday 28 July 2012
The ASX 200 Cyclically Adjusted PE (aka ASX 200 PE10 or ASX200 CAPE) – July 2012 Update


This is the Retirement Investing Today monthly update for the Australian ASX 200 Cyclically Adjusted PE (ASX 200 CAPE). Last month’s update can be found here.
Let us firstly look at the key ASX 200 market metrics:
- The ASX 200 Price at market close on Friday is 4,210 which is 2.8% above last month’s Price of 4,095 and 4.9% down year on year.
- The ASX 200 Dividend Yield is currently 5.0%.
- The ASX 200 Earnings are currently 333.
- The ASX 200 P/E Ratio is currently 12.6 compared with the a dataset (since December 1982) average P/E of 18.3
Subscribe to:
Posts (Atom)