Two pillars of my Retirement Investing Today strategy are to continually work to minimise expenses and taxes (total costs) while keeping to my required asset classes and investment types within the class. I work on the principle that I can’t control what happens in the markets but I can control the costs of investing. Now there is not much that is guaranteed in the investing world however I can’t think of any case where this strategy if done properly does not provide free return.

Showing posts with label pension. Show all posts
Showing posts with label pension. Show all posts
Sunday 5 August 2012
Monday 23 August 2010
The lowest cost low cost SIPP
My employer offers a money purchase pension scheme administered through a large UK based insurance company. I have been making substantial contributions into this scheme over the last few years which now means that it makes up 31.7% of my Retirement Investing Low Charge Portfolio. In my opinion my employer is very generous with the salary sacrifice scheme they offer as they match my contributions up to a certain limit plus they also contribute the employers national insurance that they save through the salary sacrifice. In addition as a 40% tax payer I get this paid into the pension working on the principle that some day when I retire I will structure my finances so that I am a 20% (or whatever the appropriate lower tax rate is by then) taxpayer on the money that comes out of my pension. With I fair wind I might not even be in the UK having taken my pension elsewhere using the QROPS process. Of course most of you knew this as I had detailed this and more here.
Sunday 18 April 2010
Changes to the UK State Second Pension (S2P)
This year there have been changes to the State Second Pension (S2P) rules however I don’t remember seeing this mentioned in any main stream newspapers or television news. I therefore thought it best to warn Retirement Investing Today readers so that at least you were aware and could then do your own research.
Thursday 25 March 2010
Buying Gilts, Property, International Equities and UK Equities
As an employee of a company I have the option to contribute to a pension scheme. I have made the choice as part of my retirement investing strategy to contribute to the pension scheme for the reasons laid out here.
Sunday 7 March 2010
Are pensions a good retirement planning tool? (Full text)

Where is the best place to put your money for retirement? Ask a lot of people and the automatic response is that you should put your money in a pension to get a bigger retirement pot which comes from the tax advantages given by HMRC. I however am not convinced and in fact believe the government and the pensions industry is actually close to misleading the public as to the advantages of pensions.
Saturday 6 March 2010
Are pensions a good retirement planning tool? (Part 1 of 2)

Thursday 11 February 2010
Buying Gilts, Property, International Equities and UK Equities
As an employee of a company I have the option to contribute to a pension scheme. I have made the choice as part of my retirement investing strategy to contribute to the pension scheme as the company matches my contributions up to a limit, plus as I salary sacrifice into the pension, they also generously contribute the 12.8% employers national insurance that they would have otherwise paid to HMRC. I will complete a blog on pensions hopefully in the near future.
This is new money that enters every month and is currently the equivalent of about 0.5% of my total retirement investing assets. Another months worth of contribution has just been made. This is currently automated to occur each month and will be invested as follows:
- 4% to Index Linked Gilts. This adds up to be a very small contribution but I want to just keep nibbling a little.
- 60% to UK Commercial Property. A big contribution is made here as my desired low charge portfolio requires 10% asset allocation and my current low charge portfolio is only at 8.1%.
- 21% to International Equities. My desired low charge portfolio currently requires 13.3% asset allocation and my current low charge portfolio is only at 13.1%. This is the only input to International Equities that I am currently exploiting.
- 15% to UK Equities. This is one that requires a little explaining. My desired UK Equities is 18.6% and my current UK Equities is 18.6% so I am where I need to be. Where I am underweight heavily is Emerging Markets Equities by 2.3% and my total Equities exposure is also underweight by 2% at 54%. In an ideal world I would be buying Emerging Markets however my company based pension is inflexible (like a lot of company based schemes I would guess) and the lowest cost Emerging Markets Equity fund that I can buy has fees of 2%. Now I refuse to pay anyone 2% in fees and so the compromise I have made is to try and bolster my Equities allocation while acknowledging I am underweight Emerging Markets. Not ideal I know but fits with strategy to minimise fees.
As always DYOR.
Monday 4 January 2010
2009 Yearly Retirement Investing Portfolio Review
Edited 06 June 2010: I have found more exact data allowing me to determine benchmark returns to the day. I have therefore updated the data in this post to reflect this. As the blog has developed I have also changed the method used to calculate the returns as I have learnt more accurate methods. I started with:
- [assets at end of period – assets at start of period – new money entering portfolio] divided by [assets at start of period],
- then used the mid-point Dietz which was a more accurate method,
- and now use Excel's XIRR function for anual returns. If it is not a full year I then adjust XIRR by the PRR (Personal Rate of Return) = [(1+XIRR Annualised Return)^(# of days/365)]–1.
In those post I also used incorrect weightings for the benchmark portfolio. It should have been 72% stocks/28% bonds as per here.
Apologies for the confusion but I'm learning here too.
----
2008 was a bad year for my investment portfolio and byyear end the 02 January 2009 I was -19.7% -15.7% using [assets at end of period – assets at start of period – new money entering portfolio] divided by [assets at start of period] as my return calculation method. 2009 also started badly and at one point in March my portfolio was -12.4% and we weren’t even a quarter of the way through the year. As everyone knows the markets then started recovering and I rode the wave to end the year at period 02 January 2009 to 31 December 2009 at +21.5% +24.9% including fees.
- [assets at end of period – assets at start of period – new money entering portfolio] divided by [assets at start of period],
- then used the mid-point Dietz which was a more accurate method,
- and now use Excel's XIRR function for anual returns. If it is not a full year I then adjust XIRR by the PRR (Personal Rate of Return) = [(1+XIRR Annualised Return)^(# of days/365)]–1.
In those post I also used incorrect weightings for the benchmark portfolio. It should have been 72% stocks/28% bonds as per here.
Apologies for the confusion but I'm learning here too.
----
2008 was a bad year for my investment portfolio and by
Monday 7 December 2009
Tax Efficient Investments and Tax Wrappers
You would think that governments throughout the world would be trying to encourage people to save for their own retirement and hence remove future burdens from the state. Unfortunately in the United Kingdom I don’t see the current government providing much support or encouragement here. Instead I see a lot of complexity which means unless you know exactly what you are doing you will over your investment life either:
- pay higher taxes than are necessary thereby ending up with a smaller investment pot in the future, or
- pay the same (effectively tax deferral) or lower taxes within tax wrappers but lose a lot or all of this benefit by paying higher fees / charges than needed or even in extreme cases charges on charges with in some instances the added negative of having certain restrictions on what you can and can’t do as defined by the government. Just to give one extreme example, I could even see that if you are only deferring tax within a wrapper but paying higher charges then you are actually worse off than not having a tax wrapper at all and just paying the full tax.
I guess it’s no different to anything else in life. Buyer beware and always carefully do your own research.
Minimising the tax I pay (along with the fees /charges I pay) is one of the cornerstones to my retirement strategy. I can easily show this by thinking of what percentage of my annual returns will come through dividends / interest and the affect that paying high rates of tax will have on my final retirement fund through losing on the compound interest effect. Let me give an example. Average Joe and Mr UK Average have £10,000 in share based investments that provide a dividend yield of 4.5% (average dividend yield of the S&P 500 since 1871 using the Shiller dataset). Both are higher rate 40% tax payers. Now Mr UK Average who doesn’t think about minimising taxation holds these shares outside of any tax efficient wrappers and so pays 32.5% (however in most instances this is really only 25% after tax credits on dividends are calculated). Average Joe holds half of his share based investments in tax wrappers meaning his effective tax rate is only 12.5%. I’m going to ignore capital gains to make the demonstration simple. So where are they after 20 years:
 Average Joe has 11% more assets (and the more years in the calculation the better it gets for average Joe) than Mr UK Average meaning he has the potential for 11% more income in retirement or could hold a less risky investment portfolio for the same lifestyle. Taxes on investments matter.
I use one tax efficient investment type which are National Savings and Investments Index Linked Savings Certificates. Additionally I use 2 tax wrappers which are a Pension which is a Defined Contribution Scheme and a Stocks and Shares Individual Savings Account (Stocks and Shares ISA).
Just a little about each of these as I will cover them in more detail later:
- NS&I Index Linked Savings Certificates today offer a return of the Retail Prices Index (RPI) + 1% however the real benefit, particularly for high rate tax payers is that they are tax free.
- Pensions are extremely complex things and you would think that any government would be trying to simplify them so they could be understood and make them beneficial for all tax payers to save for their future. Unfortunately this doesn’t seem to be happening. I use them as for me personally they provide huge benefits. I can however think of a number of situations where they would provide little to no benefit and in some instances could even make a person worse off. What I am always nervous about however is that with a Pension you lock your money up for a lot of years and with past history as a guide governments will most likely change the rules. I therefore don’t put all my investments here.
- Stocks & Shares ISA’s seem to be no brainer for anyone wanting to invest in the stock markets. They form a pivotal part of my investment strategy. If you look around you can find Stocks and Shares ISA’s that don’t charge you to use the tax wrapper. You still pay to buy the investments inside and these investments might also see charges however this is no different to outside the wrapper. For higher rate tax payers they provide tax benefits from both dividends and capital gains. While for low rate tax payers today, they offer only really capital gains benefits. One thought however is that you never know when you might become a higher tax rate payer or given the disastrous state of the public finances of the UK you never know when as a low rate tax payer you will be taxed on your dividends.
Saturday 5 December 2009
Building My Low Charge Investment Portfolio – Part 3 of 3
Portfolio construction starting point as previously described in Part 2:
22% Bonds (Cash, Index Linked Gilts, Index Linked Savings Certificates)
21% Australian Equities (ASX 300)
21% United Kingdom Equities (FTSE All Share)
15% International Equities (40% US, 40% EU, 20% Japan)
5% Emerging Markets Equities (MSCI Emerging Market TRN Index)
10% Property (Listed Euro Property and UK Commercial)
5% Commodities (Gold)
The final element associated with the construction of my portfolio is an attempt to assess whether the stock market is overvalued or undervalued. I am doing this as the stock market can be a highly volatile / high risk place and if I can take a calculated risk here I might be able to squeeze some more performance out of my portfolio. I will try and be underweight equities when the market appears overvalued and overweight equities when the market appears undervalued. This could be likened to timing the market which history suggests is difficult/impossible meaning I may also end up under performing compared with the traditional buy, hold and rebalance periodically strategy. Only time will tell.
The method I am going to use is that developed by Yale Professor Robert Shiller. He uses a very simple method where he looks at the monthly real (after inflation) market price of the S&P 500 and divides it by the average of the previous 10 years real earnings to get a long term historic real price earnings ratio (Shiller PE10). The real price and Shiller PE10 look to have a relatively high correlation of 0.78. A chart showing both the Shiller PE10 ratio versus the real S&P 500 can be seen below. The December 09 entry is the market close on the 04 December. My current Shiller PE10 estimate will always appear slightly different to Shiller as I use the Standard & Poors website to also enter forecast earnings estimates up to the month of interest. Since 1881 the average Shiller PE10 value has been 16.35.

Another way I have looked at this is to plot a scatter diagram of the Shiller PE10 versus the return made in 12 months time shown below. This I have calculated as the ((Price in 12 months – Price)/Price)+(Dividend in 12 months)/Price). While the R^2 value is quite low a trend line suggests there may be something to be had.

While I will use the average Shiller PE10 value I won’t go silly. I will try to squeeze some performance by on a linear scale will owning 30% less stocks when the Shiller PE10 average is Shiller PE10 Average + 10 = 26.35 and will own 30% more stocks when the Shiller PE10 average is PE10 average -10 = 6.35. I will use this methodology as a proxy for all my International Equities and United Kingdom Equities as Hale suggests a high correlation between UK Equities and International Equities and I have struggled to find good historic data for UK, European and Japanese equities. Today’s Shiller PE10 is 20.2 meaning that instead of holding 21% UK Equities today my target is 18.6%. Similarly instead of 15% International Equities today my target is 13.3%.
For my Australian Equities I have been able to find some Inflation and ASX 200 data from the Reserve Bank of Australia. Unfortunately all the data needed only starts from 1982 which is not a long time ago. Even so I have calculated and show what I will call the ASX 200 PE10 chart versus the Real ASX 200 below. I have estimated average ASX 200 PE10 to November 2009 to be 18.5. The correlation between the Real ASX 200 and the ASX 200 PE10 appears high at 0.82. For my Australian Equities I will use a nominal ASX 200 PE10 value of 16 to equate to when I hold 21% Australian Equities. Otherwise I will use the same assumptions as for the UK and International Equities. Therefore with an ASX 200 PE10 of 18.5 today my target is 19.3%.

When I am underweight I intend to hold the extra in bonds/cash. For my emerging markets equities because it is a small amount I will not vary the weighting but always target 5%.
So that’s how I’ve arrived at my target asset allocations. Today this means a Desired low Charge Portfolio of:
28.8% Bonds (Cash, Index Linked Gilts, Index Linked Savings Certificates)
19.3% Australian Equities (ASX 300)
18.6% United Kingdom Equities (FTSE All Share)
13.3% International Equities (40% US, 40% EU, 20% Japan)
5% Emerging Markets Equities (MSCI Emerging Market TRN Index)
10% Property (Listed Euro Property and UK Commercial)
5% Commodities (Gold)
Friday 4 December 2009
My Current Low Charge Portfolio – December 2009
 Another month passes.
Buying: Property, Index Linked Gilts, UK Equities, International Equity
Selling: Nothing this month
Dividends: Nothing this month
Current UK Retail Prices Index: -0.78%
Current Annual Charges: 0.60%
Current Expected Annual Return after Inflation: 4.26%
Current Return Year To Date: 22.9%
How close am I to retirement: 40.8%
Building My Low Charge Investment Portfolio – Part 2 of 3
Portfolio construction starting point as previously described in Part 1
28% Bonds
72% Equities
Continuing to learn from Hale and Bernstein I then chose to add Property as a portfolio diversifier as it can be uncorrelated to Equities and Bonds. The more uncorrelated the assets theoretically the more likelihood that some assets will be low in price (and hence required to be bought by the author) while other assets are high in price (and hence required to be sold). To give 2 examples, Bernstein presents data from 1973 to 1998 suggesting a Property – (REIT - National Association of Real Estate Investment Trusts) to US Equities correlation of 0.56 while Hale presents data suggesting a UK Property to UK Equities correlation of 0.3. The property types I have chosen to buy into are predominantly Listed European Property Securities excluding the United Kingdom and a fund buying United Kingdom commercial property. I chose to allocate 10% to this sector. Portfolio is now:
23% Bonds
67% Equities
10% Property (Listed Euro Property and UK Commercial)
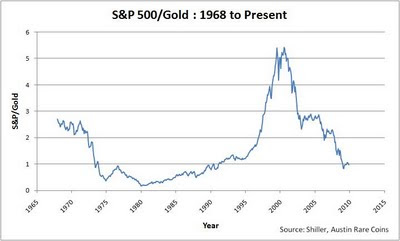
Next I chose to add some commodities exposure. Initially I went for exposure via a low cost ETC that gave exposure to energy, precious metals, industrial metals, livestock and agriculture via Futures contracts. In hindsight I think that what I did was a mistake and the reason you should always do your own research as I lost quite a lot of money here. Before anybody buys direct exposure to commodities I suggest you read about Contango / Backwardation , Counter-party risk. Additionally many ETC / ETF’s allow you to leverage your returns. Be sure to understand the affects of this also as they are typically rebalanced daily meaning performance will differ from what you expect. So what did I buy? In the end I settled on a simple vanilla ETF that buys physical gold and so tracks the gold spot price minus fees. Why gold? Using the Shiller dataset for the S&P 500 and the Austin Rare Coins dataset for Gold for the years 1968 to present day a relatively low correlation of 0.5 is achieved. What does 0.5 look like? Well rather than just show actual prices in history I present a chart showing real prices (ie after inflation) for both assets.
 Additionally, it’s also worth looking at a chart showing the ratio of the S&P 500 to Gold (excluding inflation).
As always make up your own mind but I’ve settled for 5% to be allocated to Gold. As commodities can be highly volatile I’ve taken my Gold allocation from equities. Portfolio is now:
23% Bonds
62% Equities
10% Property (Listed Euro Property and UK Commercial)
5% Commodities (Gold)
Now to how I’ve allocated my equities. Hale suggests that traditional developed world equities have very high correlations of about 0.9 and so do not significantly diversify the portfolio. I guess this is because of globalisation. Emerging Markets on the other hand seem to have a much lower correlation of around 0.7. I’ve still chosen to spread widely through the world to remove country risk as much as possible and also to pick up some swings from exchange rates. I’ve settled on 21% Australian Equities, 21% UK Equities, 15% International Equities and 5% Emerging Market Equities. My Australian Equities are generally ASX 300 low cost trackers. My UK Equities are generally FTSE All Share low cost trackers. My International Equities are targeted to be 40% US, 40% Europe and 20% Japan. My 5% Emerging Markets simply track the MSCI Emerging Market TRN Index. Portfolio is now:
22% Bonds
21% Australian Equities (ASX 300)
21% United Kingdom Equities (FTSE All Share)
15% International Equities (40% US, 40% EU, 20% Japan)
5% Emerging Markets Equities (MSCI Emerging Market TRN Index)
10% Property (Listed Euro Property and UK Commercial)
5% Commodities (Gold)
Finally to my bond allocation. Within my bond allocation the first thing I do is hold 6 months worth of salary in cash. Just in case... Next within low tax wrappers I’m holding predominantly holding Index linked Gilts as I’m always concerned about returns after inflation. The final variation from a traditional bond allocation is that outside of the tax wrappers where instead of bonds I am holding what I consider to be a great little product from National Savings and Investments which are Index linked Savings Certificates. Portfolio is now:
22% Bonds (Cash, Index Linked Gilts, Index Linked Savings Certificates)
21% Australian Equities (ASX 300)
21% United Kingdom Equities (FTSE All Share)
15% International Equities (40% US, 40% EU, 20% Japan)
5% Emerging Markets Equities (MSCI Emerging Market TRN Index)
10% Property (Listed Euro Property and UK Commercial)
5% Commodities (Gold)
So that’s my portfolio based on what I think are basically traditional asset allocation strategies. The final portfolio weightings however are where I try and introduce allocations that vary based on what I think is a sensible method for determining asset values at any point in time. This I’ll cover in Part 3.
28% Bonds
72% Equities
Continuing to learn from Hale and Bernstein I then chose to add Property as a portfolio diversifier as it can be uncorrelated to Equities and Bonds. The more uncorrelated the assets theoretically the more likelihood that some assets will be low in price (and hence required to be bought by the author) while other assets are high in price (and hence required to be sold). To give 2 examples, Bernstein presents data from 1973 to 1998 suggesting a Property – (REIT - National Association of Real Estate Investment Trusts) to US Equities correlation of 0.56 while Hale presents data suggesting a UK Property to UK Equities correlation of 0.3. The property types I have chosen to buy into are predominantly Listed European Property Securities excluding the United Kingdom and a fund buying United Kingdom commercial property. I chose to allocate 10% to this sector. Portfolio is now:
23% Bonds
67% Equities
10% Property (Listed Euro Property and UK Commercial)
Next I chose to add some commodities exposure. Initially I went for exposure via a low cost ETC that gave exposure to energy, precious metals, industrial metals, livestock and agriculture via Futures contracts. In hindsight I think that what I did was a mistake and the reason you should always do your own research as I lost quite a lot of money here. Before anybody buys direct exposure to commodities I suggest you read about Contango / Backwardation , Counter-party risk. Additionally many ETC / ETF’s allow you to leverage your returns. Be sure to understand the affects of this also as they are typically rebalanced daily meaning performance will differ from what you expect. So what did I buy? In the end I settled on a simple vanilla ETF that buys physical gold and so tracks the gold spot price minus fees. Why gold? Using the Shiller dataset for the S&P 500 and the Austin Rare Coins dataset for Gold for the years 1968 to present day a relatively low correlation of 0.5 is achieved. What does 0.5 look like? Well rather than just show actual prices in history I present a chart showing real prices (ie after inflation) for both assets.
 Additionally, it’s also worth looking at a chart showing the ratio of the S&P 500 to Gold (excluding inflation).
As always make up your own mind but I’ve settled for 5% to be allocated to Gold. As commodities can be highly volatile I’ve taken my Gold allocation from equities. Portfolio is now:
23% Bonds
62% Equities
10% Property (Listed Euro Property and UK Commercial)
5% Commodities (Gold)
Now to how I’ve allocated my equities. Hale suggests that traditional developed world equities have very high correlations of about 0.9 and so do not significantly diversify the portfolio. I guess this is because of globalisation. Emerging Markets on the other hand seem to have a much lower correlation of around 0.7. I’ve still chosen to spread widely through the world to remove country risk as much as possible and also to pick up some swings from exchange rates. I’ve settled on 21% Australian Equities, 21% UK Equities, 15% International Equities and 5% Emerging Market Equities. My Australian Equities are generally ASX 300 low cost trackers. My UK Equities are generally FTSE All Share low cost trackers. My International Equities are targeted to be 40% US, 40% Europe and 20% Japan. My 5% Emerging Markets simply track the MSCI Emerging Market TRN Index. Portfolio is now:
22% Bonds
21% Australian Equities (ASX 300)
21% United Kingdom Equities (FTSE All Share)
15% International Equities (40% US, 40% EU, 20% Japan)
5% Emerging Markets Equities (MSCI Emerging Market TRN Index)
10% Property (Listed Euro Property and UK Commercial)
5% Commodities (Gold)
Finally to my bond allocation. Within my bond allocation the first thing I do is hold 6 months worth of salary in cash. Just in case... Next within low tax wrappers I’m holding predominantly holding Index linked Gilts as I’m always concerned about returns after inflation. The final variation from a traditional bond allocation is that outside of the tax wrappers where instead of bonds I am holding what I consider to be a great little product from National Savings and Investments which are Index linked Savings Certificates. Portfolio is now:
22% Bonds (Cash, Index Linked Gilts, Index Linked Savings Certificates)
21% Australian Equities (ASX 300)
21% United Kingdom Equities (FTSE All Share)
15% International Equities (40% US, 40% EU, 20% Japan)
5% Emerging Markets Equities (MSCI Emerging Market TRN Index)
10% Property (Listed Euro Property and UK Commercial)
5% Commodities (Gold)
So that’s my portfolio based on what I think are basically traditional asset allocation strategies. The final portfolio weightings however are where I try and introduce allocations that vary based on what I think is a sensible method for determining asset values at any point in time. This I’ll cover in Part 3.
Tuesday 1 December 2009
Building My Low Charge Investment Portfolio – Part 1 of 3
Note added 11 January 2009. My calculations below generally use arithmetic means. It may be more appropriate to use compound annual growth rates. See here.
Before I start let me emphasise that my strategy is a long term one. I am not a share trader. In fact, I tried it very briefly and was hopeless. For me the duration of my investment strategy is the rest of my life as I’m using it for retirement planning. Retirement in my definition is that work becomes optional and so I’m trying to get there as quickly as possible. However I guess it might also work for other long term goals – university fees for a newly born child, planning to give a newly born child a head start on their 18th birthday etc.
Now the first thing I did was some reading. I would like to recommend two very good books – “Smarter Investing : Simpler Decisions for Better Results” by Tim Hale and “The Intelligent Asset Allocator” by William Bernstein. If you are UK based I’d start with Hale and if US based then Bernstein. I can’t highlight enough how beneficial these books were in my retirement strategy.
The first two building blocks I chose were equities and bonds.
What returns can I expect from equities and bonds? Firstly I will always try and talk in after inflation terms (I’ll typically use the word Real) as we all want to maintain our standard of leaving. Please don’t underestimate the damage of inflation to your wealth. To demonstrate how damaging inflation is I will use a very good data set that is available from Yale Professor Robert Shiller’s website1 that lists US CPI data. This demonstrates that to have the equivalent of $12.46 in 1871 today would require you to have in your hand $216.24. This has made me always consider inflation in everything I do.
So to equity returns. Hale suggests that for the UK from the period 1900 to 2004 real (ie after inflation) average equity returns were 7.3%. Bernstein suggests that for US 1926 to 1998 equity returns averaged 11.22% however again using the Shiller1 data set as a basis suggests average inflation over that period was 3.2% so a real return of 8%. Using the Shiller dataset from 1871 to present day for US equities suggests that the real average capital gain was 3.5% and the real average dividend was 4.5% for an average real return of 8%. So as close as I need it to be for what I am doing.
Now to bond returns. Hale suggests that for the UK from the period 1900 to 2004 real average bond returns were 2.3%. Bernstein suggests that for US 1926 to 1998 5 year treasury returns averaged 5.31% for a real return of 2.11%. Again as close as I need it to be.
Finally combining equity and bonds as my basic building blocks and having assessed my attitude to risk I came to a 72% equity and 28% bond weighting. In multiple locations I have heard a ‘rule of thumb’ that you should own 100 minus your age in equities. I’m more aggressive than that at this stage of my life.
In projecting retirement dates I’m assuming real average equity returns of 7.3% and for the majority of my “bonds” real average returns of 1%. The 1% I’ll explain in the future when I look at some strategies I’m using to minimise the tax I pay. Assuming I stayed at this allocation and achieved averages I could assume an instantaneous real average return of 72% x 7.3% + 28% x 1% = 5.5% - 0.6% (my current average fees) = 4.9% per annum before taxation. Now clearly I won’t get this consistently as I’ll reduce equity weightings as I get older and nothing works in averages but it demonstrates an order of magnitude. Worst case we have a big crash in equities and/or bonds and I get a return much worse than this. Hale shows the effects and risks of this quite nicely.
Now by rebalancing regularly to take advantage of the fact that over the long term equities and bonds are not perfectly correlated I’ll end up buying whatever is lowest in value and selling whatever is highest to hopefully give a little more of a kick.
I could have probably left it at that and hopefully lived happily ever after however as I’ll show as I blog I’ve gone a lot further than that.
To be continued in Part 2 here
Sunday 29 November 2009
My Current Low Charge Portfolio – November 2009

As this is the first My Current Low Charge Portfolio let me explain what I will be presenting monthly. I will present 2 charts. The first is My Current Low Charge Portfolio and the second is a Desired Low Charge Portfolio. The Desired is calculated using a number of criteria which will be explained over time but it will vary when Equity Market prices or earnings increase or decrease in price. Additionally it will change as I age.
Over time I will explain each of my asset classes in more detail.
Current UK Retail Prices Index: -0.78%
Current Annual Charges: 0.59%
Current Expected Annual Return after Inflation: 4.24%
Current Annual Charges: 0.59%
Current Expected Annual Return after Inflation: 4.24%
Current Return Year To Date: 21.5%
How close am I to retirement: 39.7%
First Post – The 5 W’s
As this is the first post I thought I would give a little introduction as to what motivated me to start this blog looking at my own personal Retirement Investing. This is best done using the 5 W’s.
Who:
As my profile suggests I am a mid 30’s average Joe who became disillusioned with the Financial Sector in 2007.
What:
My investment strategy is really simple. The principles are:
- invest across a number of different asset classes
- buy whatever asset class has been performing the worst
- reduce exposure to whatever asset class has been performing the best
- minimise the fees that I pay
- minimise the taxes I pay by using tax wrappers where possible
- never invest in anything I don’t understand (so no CDO’s or MBS’s)
When:
I will try and write regularly however this is not my day job which keeps me extremely busy. I will attempt to cover four main topics regularly:
- my current Portfolio including expected average return after inflation and the current average fees
- a more detailed description of what I am investing in and my methodology for Portfolio Allocation
- describe whenever I make a buy or sell decision
- anything I am currently finding interesting in the financial markets
Where:
I currently live in the United Kingdom and so I will in due course use words like Pension’s and ISA’s as the blog develops. My investments will however be in many countries throughout the world so people from all countries should hopefully find it interesting.
Why:
I was looking for a Financial Planner in 2007 and whenever I made my first contact I came across a massive behemoth of a building in a prime location that must have cost millions, a lovely foyer and people in very smart suits. I am sure these guys/girls add real value and help many people achieve their goals. However for some reason I could only think that it would be me paying for all of this.
At about the same time I came across a book title called “Where are the Customer Yachts” by Fred Schwed. This had me thinking even more.
When I started looking at possible investment opportunities the fees and charges just leapt out at me. To demonstrate this have a look at the table below which demonstrates how fees and charges can affect your portfolio over time. I have assumed that inflation is 2% and the return including inflation is 6%. The fund on the left I have called My Low Charge Portfolio. I never buy any investments that have an initial charge and I am always looking to choose the best investment for the least annual charge in this case 0.59%. I chose this figure as it is my current annual charge on my total portfolio. The fund on the right is fictitious but is not unlike some Balanced Funds you can buy. It has initial charges of 4% and an annual charge of 1.5%. Over a 20 year investment period the difference is astronomical. My Low Charge Portfolio is 24% large than the Balanced Portfolio. This has been achieved doing nothing more than minimising charges.

Subscribe to:
Posts (Atom)