

Showing posts with label asset allocation. Show all posts
Showing posts with label asset allocation. Show all posts
Thursday 11 March 2010
My Current Low Charge Portfolio – March 2010
Monday 15 February 2010
Guest post – alternate investing strategy
Today is a guest post from a reader of Retirement Investing Today. Two elements of their investing strategy have inspired me. Firstly, they are in their early twenties and have already clearly accepted full responsibility for their own actions with respect to their own economic well being. I certainly wasn’t at that point at that age. Secondly, rather than just following the herd mentality with regards to investing they have adopted an investing strategy which includes a very interesting asset class – whisky. As with all Retirement Investing Strategy readers I wish them much success and I hope you enjoy reading their story. I know I did.
"
I am fairly new to the investment game, this being my second financial year as an investor. I decided against joining a pension scheme as I do not like the idea of saving for all of my working life and planning my retirement on the faith (that is very low) of an annuity company providing me with a good income. I want to plan my retirement and manage my own investments. I am in my early twenties and my plan is to accumulate enough capital by the time I am in my mid-fifties to provide an acceptable income that can be enjoyed for the rest of my life. When I have finished retiring, the income from my capital will then be able to be enjoyed by my successor(s), rather than an annuity company. Following the recommendation on this blog, I have purchased a copy of “Smarter Investing - Simpler Decisions for Better Results” by Tim Hale. I cannot recommend this book enough.
My target portfolio at the moment is:
Cash - 65%
UK Equities - 25%
Gold - 5%
Whisky - 5%
The large percentage that is allocated to cash is not because I am cautious but because I have a short term goal to save enough to use as a deposit to fund a home within three years, which is too short to invest.
My contribution to this blog today will be about whisky as there is a noticeable lack of information on the Internet about this asset class. Whisky currently makes up approximately 5% of my portfolio.
Whisky is a spirit that is enjoyed all over the world. Recently, we have witnessed a very large growth in the demand of Scottish whisky due mainly to the rapidly growing middle classes in developing countries. Supply has not been expanding nearly as fast (I can tell you this personally as I live in Moray, which has the largest concentration of single-malt distilleries anywhere in Scotland). My reason for allocating 5% of my portfolio to single-malt Scottish whisky is that I aim to profit from the expanding ratio between supply and demand. Historically also, whisky collecting has generally been a very profitable pursuit, although a certain level of knowledge on the subject is essential.
There are essentially three ways to invest in whisky:
1 – Buy shares in a company that makes profit from the whisky industry
2 – Buy young whisky casks en primeur and hold them until that have matured
3 – Buy bottles of whisky and hold them in order to take advantage of dwindling supply.
I am concerned with the third option.
It is important to point out at this point that bottled whisky does not mature further and will not change in character if it is stored correctly (more on this later). It is also important to select bottles from iconic well established distilleries, as these are the ones that will be most in demand. The main distilleries that I am interested in are Ardbeg, MacAllan, Balvenie, Talisker, Glenfiddich and Port Ellen. These are all very well respected and are in high demand all over the world. The last one that I mentioned has closed so it goes without saying that demand for their expressions are going to increase.
Most of these distilleries have an online committee/club that is free to join. Quite often, special limited edition expressions are offered only to member. The last committee exclusive that Ardbeg offered (Ardbeg Supernova) was ranked as the world’s second finest whisky and now sells for 150% of the price less than one year on. In years to come as more of these limited bottles are consumed I expect the value to increase.
The ideal bottle of whisky for investment purposes will be (in order of preference):
1 – From an iconic distillery (and if it has closed even better).
2 – Part of a very limited release
3 – Aged beyond 30 years (although younger expressions are also worth considering if they meet the rest of these requirements)
4 – Mostly unavailable to the open marker (i.e., committee releases or distillery exclusives)
5 – Taste good (I use the latest edition of Jim Murray’s whisky bible for this).
Take note that bottles are also produced by external bottling companies who buy casks en-primeur and bottle them much later. Often this is the only way to buy expressions from closed distilleries. Some external bottling companies to consider include Duncan Taylor & Co and Douglas Laing & Co.
I recently acquired a 30 year old bottle of MacAllan, bottled by Douglas Laing & Co. This particular expression was bottled after the whisky has matured in a rum cask and is one of just under two hundred bottles. I believe that this expression has a very high chance of increasing in value significantly.
There are also quite a few rare bottles that are only available by visiting the distillery. This can be very costly if you do not live near them (this is where I have an advantage). If you are able to visit a distillery at a small cost, it is definitely worth having a look to see what exclusives are available.
Whisky bottles are not as sensitive to wine as they have a high alcohol content. They can be stored anywhere that is not subject to major temperature fluctuations, however they must be stored within their tube or box, to prevent light from oxidising the whisky.
As far as taxes is concerned, duty is obviously paid when you purchase the bottles (unless you buy them from an airport), however I believe that like wine, whisky is exempt from capital gains tax.
I am very optimistic that my ever growing whisky collection will generate a good return for my portfolio however there is the possibility that some bottles will not increase in value as much as I hope they will. If this is the case I might even enjoy a nice dram of scotch when I retire!
Please do your own research.
"
"
I am fairly new to the investment game, this being my second financial year as an investor. I decided against joining a pension scheme as I do not like the idea of saving for all of my working life and planning my retirement on the faith (that is very low) of an annuity company providing me with a good income. I want to plan my retirement and manage my own investments. I am in my early twenties and my plan is to accumulate enough capital by the time I am in my mid-fifties to provide an acceptable income that can be enjoyed for the rest of my life. When I have finished retiring, the income from my capital will then be able to be enjoyed by my successor(s), rather than an annuity company. Following the recommendation on this blog, I have purchased a copy of “Smarter Investing - Simpler Decisions for Better Results” by Tim Hale. I cannot recommend this book enough.
My target portfolio at the moment is:
Cash - 65%
UK Equities - 25%
Gold - 5%
Whisky - 5%
The large percentage that is allocated to cash is not because I am cautious but because I have a short term goal to save enough to use as a deposit to fund a home within three years, which is too short to invest.
My contribution to this blog today will be about whisky as there is a noticeable lack of information on the Internet about this asset class. Whisky currently makes up approximately 5% of my portfolio.
Whisky is a spirit that is enjoyed all over the world. Recently, we have witnessed a very large growth in the demand of Scottish whisky due mainly to the rapidly growing middle classes in developing countries. Supply has not been expanding nearly as fast (I can tell you this personally as I live in Moray, which has the largest concentration of single-malt distilleries anywhere in Scotland). My reason for allocating 5% of my portfolio to single-malt Scottish whisky is that I aim to profit from the expanding ratio between supply and demand. Historically also, whisky collecting has generally been a very profitable pursuit, although a certain level of knowledge on the subject is essential.
There are essentially three ways to invest in whisky:
1 – Buy shares in a company that makes profit from the whisky industry
2 – Buy young whisky casks en primeur and hold them until that have matured
3 – Buy bottles of whisky and hold them in order to take advantage of dwindling supply.
I am concerned with the third option.
It is important to point out at this point that bottled whisky does not mature further and will not change in character if it is stored correctly (more on this later). It is also important to select bottles from iconic well established distilleries, as these are the ones that will be most in demand. The main distilleries that I am interested in are Ardbeg, MacAllan, Balvenie, Talisker, Glenfiddich and Port Ellen. These are all very well respected and are in high demand all over the world. The last one that I mentioned has closed so it goes without saying that demand for their expressions are going to increase.
Most of these distilleries have an online committee/club that is free to join. Quite often, special limited edition expressions are offered only to member. The last committee exclusive that Ardbeg offered (Ardbeg Supernova) was ranked as the world’s second finest whisky and now sells for 150% of the price less than one year on. In years to come as more of these limited bottles are consumed I expect the value to increase.
The ideal bottle of whisky for investment purposes will be (in order of preference):
1 – From an iconic distillery (and if it has closed even better).
2 – Part of a very limited release
3 – Aged beyond 30 years (although younger expressions are also worth considering if they meet the rest of these requirements)
4 – Mostly unavailable to the open marker (i.e., committee releases or distillery exclusives)
5 – Taste good (I use the latest edition of Jim Murray’s whisky bible for this).
Take note that bottles are also produced by external bottling companies who buy casks en-primeur and bottle them much later. Often this is the only way to buy expressions from closed distilleries. Some external bottling companies to consider include Duncan Taylor & Co and Douglas Laing & Co.
I recently acquired a 30 year old bottle of MacAllan, bottled by Douglas Laing & Co. This particular expression was bottled after the whisky has matured in a rum cask and is one of just under two hundred bottles. I believe that this expression has a very high chance of increasing in value significantly.
There are also quite a few rare bottles that are only available by visiting the distillery. This can be very costly if you do not live near them (this is where I have an advantage). If you are able to visit a distillery at a small cost, it is definitely worth having a look to see what exclusives are available.
Whisky bottles are not as sensitive to wine as they have a high alcohol content. They can be stored anywhere that is not subject to major temperature fluctuations, however they must be stored within their tube or box, to prevent light from oxidising the whisky.
As far as taxes is concerned, duty is obviously paid when you purchase the bottles (unless you buy them from an airport), however I believe that like wine, whisky is exempt from capital gains tax.
I am very optimistic that my ever growing whisky collection will generate a good return for my portfolio however there is the possibility that some bottles will not increase in value as much as I hope they will. If this is the case I might even enjoy a nice dram of scotch when I retire!
Please do your own research.
"
Saturday 13 February 2010
My allocation to emerging market equities
Tim Hale in his book ‘Smarter Investing : Simpler Decisions For Better Results’ provides some tips for investing in emerging markets. These are:
“
- do so in moderation;
- Own a diversified pool of markets, rather than putting all your eggs in one basket, such as China, despite what the Sunday papers may say;
- be prepared for the times when returns diverge substantially from UK and developed markets on the downside;
- don’t be overly optimistic about the degree to which a free lunch is on offer
“
Additionally he suggests that the correlation between emerging markets and developed markets is 0.6 although he also states that this could be generous. I have also considered that “from 1987 to 2004 emerging market equities only beat US equities by 1 percent ... but with around twice the level of volatility...”
With all this in mind plus knowing that I want to minimise fees and taxes I have positioned my retirement investing emerging markets equities as follows:
- Investing in moderation with a desired allocation of only 5%.
- The ETF owns a diversified pool of markets which I detail below.
- I am prepared for times when returns diverge substantially which should help me to buy low and sell high as I have described in previous posts.
- I am not being overly optimistic about the free lunch.
- I am buying the ETF’s within my ISA. I have done this as picking up on the high volatility point means that I may have to buy and sell often which is in my opinion best done in a tax wrapper to prevent capital gains tax ever becoming payable.
- I have minimised fees by buying an emerging markets exchange traded fund (ETF)
My Emerging Markets Equity ETF asset allocation is as follows:
- 16.9% China
- 15.7% Brazil
- 12.2% South Korea
- 11.0% Taiwan
- 8.7% India
- 6.9% South Africa
- 6.6% Russia
- 4.3% Mexico
- 2.7% Malaysia
- 14.9% Other
As always DYOR.
“
- do so in moderation;
- Own a diversified pool of markets, rather than putting all your eggs in one basket, such as China, despite what the Sunday papers may say;
- be prepared for the times when returns diverge substantially from UK and developed markets on the downside;
- don’t be overly optimistic about the degree to which a free lunch is on offer
“
Additionally he suggests that the correlation between emerging markets and developed markets is 0.6 although he also states that this could be generous. I have also considered that “from 1987 to 2004 emerging market equities only beat US equities by 1 percent ... but with around twice the level of volatility...”
With all this in mind plus knowing that I want to minimise fees and taxes I have positioned my retirement investing emerging markets equities as follows:
- Investing in moderation with a desired allocation of only 5%.
- The ETF owns a diversified pool of markets which I detail below.
- I am prepared for times when returns diverge substantially which should help me to buy low and sell high as I have described in previous posts.
- I am not being overly optimistic about the free lunch.
- I am buying the ETF’s within my ISA. I have done this as picking up on the high volatility point means that I may have to buy and sell often which is in my opinion best done in a tax wrapper to prevent capital gains tax ever becoming payable.
- I have minimised fees by buying an emerging markets exchange traded fund (ETF)
My Emerging Markets Equity ETF asset allocation is as follows:
- 16.9% China
- 15.7% Brazil
- 12.2% South Korea
- 11.0% Taiwan
- 8.7% India
- 6.9% South Africa
- 6.6% Russia
- 4.3% Mexico
- 2.7% Malaysia
- 14.9% Other
As always DYOR.
Thursday 11 February 2010
Buying Gilts, Property, International Equities and UK Equities
As an employee of a company I have the option to contribute to a pension scheme. I have made the choice as part of my retirement investing strategy to contribute to the pension scheme as the company matches my contributions up to a limit, plus as I salary sacrifice into the pension, they also generously contribute the 12.8% employers national insurance that they would have otherwise paid to HMRC. I will complete a blog on pensions hopefully in the near future.
This is new money that enters every month and is currently the equivalent of about 0.5% of my total retirement investing assets. Another months worth of contribution has just been made. This is currently automated to occur each month and will be invested as follows:
- 4% to Index Linked Gilts. This adds up to be a very small contribution but I want to just keep nibbling a little.
- 60% to UK Commercial Property. A big contribution is made here as my desired low charge portfolio requires 10% asset allocation and my current low charge portfolio is only at 8.1%.
- 21% to International Equities. My desired low charge portfolio currently requires 13.3% asset allocation and my current low charge portfolio is only at 13.1%. This is the only input to International Equities that I am currently exploiting.
- 15% to UK Equities. This is one that requires a little explaining. My desired UK Equities is 18.6% and my current UK Equities is 18.6% so I am where I need to be. Where I am underweight heavily is Emerging Markets Equities by 2.3% and my total Equities exposure is also underweight by 2% at 54%. In an ideal world I would be buying Emerging Markets however my company based pension is inflexible (like a lot of company based schemes I would guess) and the lowest cost Emerging Markets Equity fund that I can buy has fees of 2%. Now I refuse to pay anyone 2% in fees and so the compromise I have made is to try and bolster my Equities allocation while acknowledging I am underweight Emerging Markets. Not ideal I know but fits with strategy to minimise fees.
As always DYOR.
Tuesday 9 February 2010
My Current Low Charge Portfolio – February 2010
 Buying (New money): As always I contributed about 60% of my gross salary towards my retirement investing strategy. Since my last post the allocations I have made are 100% Cash.
Asset Movements: As I detailed here I also moved about 0.6% of my total retirement investing assets from cash to commodities (gold).
Selling: Nothing this month
Dividends: Australian Equites paid dividends equal to 1.6% of the total value of my Australian Equities. These dividends were moved to cash.
Current UK Retail Prices Index: 2.9%
Current Annual Charges: 0.59%
Current Expected Annual Return after Inflation: 4.1%
Current Return Year To Date (from 01 January 2010): -2.8%
How close am I to retirement: 39.7% down from 41.3%. Retirement can move further or closer each month and is affected by movements in asset allocations, asset prices or additions/withdrawals to my current low charge portfolio.
The following are the highlights for the month:
- Desired Cash portion moves from 12.4% to 11.5%. This month I have moved further from the desired by going from 13.5% to 14.0%.
- Desired Bonds portion doesn’t move from 17.4%. This month I have moved further from the desired by going from 20.1% to 20.8%.
- Desired Property stays constant at 10.0%. This month I have moved closer to the desired by going from 7.9% to 8.1%.
- Desired Commodities stays constant at 5.0%. This month I have moved closer to the desired by going from 2.6% to 3.2% with the gold purchase.
- Desired International Equity portion moves from 12.9% to 13.3%. This month I have moved further from the desired by going from 13.3% to 13.1%.
- Desired Emerging Market Equities stays constant at 5.0%. This month I have moved further from the desired by going from 2.9% to 2.7%.
- Desired Australian Equity portion stays moves from 19.3% to 19.2%. This month I have moved closer to the desired by going from 20.5% to 19.5%. As I mentioned above dividends helped me to remove some assets from here.
- Desired UK Equity portion moves from 18.0% to 18.6%. This month I am right on the desired by going from 19.3% to 18.6%.
Sunday 7 February 2010
Free Asset Allocator Website
 I am running my entire retirement investing strategy including expected annual returns and projected retirement dates from an excel spreadsheet. Today though, I stumbled upon a nice little tool that looks to be written by Morningstar which provides a quick way of mixing up simple asset allocations to project expected returns. Additionally if you enter the portfolio value, annual investments, desired years to retirement or similar and your total financial goal it provides a probability of reaching the goal. Link here.
The website states “Asset Allocator helps you assess the likelihood of meeting your financial goals based on your current financial situation. If you find that you are not on track to meet your goals you can adjust certain criteria and immediately see the effect of your portfolio's growth potential.”
I entered my retirement investing strategy into the site which included a Portfolio Value which is currently at 40% of my Financial Goal. My Annual Investments were based on me investing around 60% of my gross annual earnings and I entered my time to retirement (Years) as 7 years. Asset Mix was entered as my Desired Low Charge Portfolio as I describe regularly on the site including here.
The Expected Return was provided as 8.99% with a 3 year standard deviation of 13.18. An Expected Return of 8.99% seems a little bullish for my tastes. Using my models I have a current expected annual return after inflation of 4.2%. The UK arithmetic mean of the retail prices index (RPI) since 1987 is 3.5%. Totally these would give an expected return of around 7.7% before inflation which is a variation of 1.29%.
What is also provided by the website is a Probability of [reaching my] Goal. In my case this was provided as 91%. I’ll take those odds...
As always DYOR.
Sunday 31 January 2010
My allocation to international equities
 Tim Hale in his book ‘Smarter Investing : Simpler Decisions For Better Results’ states that ‘investing in a range of developed equity markets such as those in North America, the European Union, Japan and Australasia, provides the potential to deliver comparable returns, given similar levels of risk, long term rates of economic growth and reasonably comparable levels of governance, law, political stability and capitalist economics...’
However, he also mentions that investing in developed international equity markets can expose you to economic cycles / pressures that are out of sync and currency exchange rates. These types of effects can be clearly seen by looking at the chart above which has been prepared using the Yahoo Finance website. The period used is December 1989 to the present day with the red line being the S&P 500 (USA), the blue line being the FTSE 100 (United Kingdom) and the green line being the Nikkei 225 (Japan).
It is these types of effects that I am looking to take advantage of in my retirement investing strategy by regularly balancing back to my desired regional allocation within my international equities allocation. This is exactly the same principle I am using with my total low charge portfolio allowing me to buy when the market is low and sell when the market is high.
When choosing what regions to invest in I wanted to also ensure that my allocations were large enough to make a difference within my total low charge portfolio. For example my nominal allocation (before allowing for corrections in line with PE10 ratios) to international equities is 15%. If within my international equities I have an allocation to a region at 20% then this will affect 3% of the total portfolio which matters. If I went down as low as 5% then the total affect would be only 0.75%. A 10% swing in stock market prices in this region would then only make a difference of 0.075% to the total portfolio which in my opinion is insignificant.
So what regions am I allocating to my international equities asset allocation? I’ve kept it really simple with desired allocations of:
- 40% United States
- 40% Developed Europe (France, Germany, Italy, Spain, Netherlands, Switzerland etc)
- 20% Japan
My current asset allocation is:
- 38% United States
- 38% Developed Europe
- 21% Japan
- 3% Other
Others include South & Central America, Emerging Europe, Middle East & Africa and Developed Asia. These other regions have not been deliberately chosen but are merely the by product of buying low cost funds that cover a little more than the regions I am interested in.
Sectors within these regions include energy, materials, industrials, consumer discretionary, consumer staples, health care, financials and information technology.
As always DYOR.
Wednesday 27 January 2010
How to Make a Million UK Pounds
According to the Camelot Group around 70% of the adult population regularly play The National Lottery. Personally, I find that number worryingly high. So while I suspect 70% of the population think that this is one method to make a million I personally don’t like the odds with around a 1 in 14,000,000 chance of hitting the big one.
I’m going to propose an alternate method for UK residents. Unfortunately my method is not as instantaneous and involves a lot of dedication. However I think my method has much better odds.
So how does it work?
The first thing I need is a stocks and shares ISA. These are a great product as once your money is invested in one all returns are tax free. I have to be careful though and ensure my stocks and shares ISA does not charge me an annual fee. As of the 6th April 2010 every UK saver will be able to invest up to £10,200. For my method I’m going to suggest I stay very focused and invest the full £10,200.
The next thing to do is to decide what stocks and shares to buy within my ISA. Tim Hale in his book “Smarter Investing : Simpler Decisions for Better Results” suggests that the arithmetic average for UK real (after inflation) equity returns could be 7.0%. He also suggests UK real (after inflation) bond average returns could be 2.3%. So I’ll take these two building blocks and build a basic portfolio that consists of 60% UK equities and 40% UK bonds. I then decide to rebalance this asset allocation regularly. This could give me an average real return of around 5.1%.
Now I need to buy those equities and bonds. With a bit of shopping around I should be able to find exchange traded funds (ETF’s) for both UK equities and UK bonds to buy within my ISA with fees of less than 0.5% per annum. I’ll be conservative and assume I spend the whole 0.5% meaning my average expected return is now 5.1% - 0.5% = 4.9%.
Now of course the UK government always wants a bit of inflation. Since 1988 the average of the Retail Prices Index (RPI) has been around 3.5%. So I’ll add the inflation on 4.9% + 3.5% = 8.1% to give an average expected annual return.
Now I’m going to let the magic of compound interest go to work.
After 5 years I’ve invested £51,000 of my own money and assuming straight line average returns I might have around £65,000.
After 15 years I’ve invested £153,000 of my own money and compound interest has started working for me as I might have around £302,000.
After 25 years I’ve invested £255,000 of my own money and I might have around £821,000.
Finally, after 28 years I’ve invested £285,600 of my own money and I might have around $1,073,000. I’m a millionaire.
Of course in 28 years my one million pounds won’t have the buying power of today. Assuming the 3.5% inflation I mentioned above means my £1,000,000 would be worth around £587,000 today. That however is still a lot of money.
As always DYOR.
Sunday 24 January 2010
Buying Gold
I made the decision to buy gold last week. At the close on Friday gold had come off its highs to be at $1091.50. In British pounds gold was off its November peak by about 5%. The buy was not big. I nibbled by transferring about 0.6% of my total retirement investing assets from cash held in British pounds.
So when weighing up the buy what were the pro’s that I could come up with:
1. My desired low charge portfolio has an asset allocation dedicated to commodities and more specifically to gold of 5%. As I highlighted on Monday my current low charge portfolio mainly through contributing around 60% of my gross earnings towards my retirement investing strategy had seen my actual gold holdings reduce to 2.6% portfolio. This was too low.
2. Gold in 1980 reached a real monthly average price of $1,728.
3. It looks as though inflation may be among us with the RPI leaping to 2.4%. My personal feeling is that the Bank of England will not raise interest rates to counter this so I am thinking I may need more inflation protection than I already have.
The con’s that I could come up with were:
1. I hadn’t bought gold for some time as my analysis showed that if gold was following the trend line it would have a real price of $630.
2. The average real (after inflation) price for gold since 1968 has been $599. This suggested that gold had a good chance of returning to trend in the long term.
As always DYOR.
Monday 18 January 2010
My Current Low Charge Portfolio – January 2010
 Another month passes.
Buying: As always I contributed about 60% of my gross salary towards my retirement investing strategy. Of this 60% the allocations I made are 64.7% Cash, 5.3% UK Equities, 7.4% International Equities, 1.4% Index Linked Gilts and 21.2% Property.
Selling: Nothing this month.
Dividends: My Australian Equities paid dividends of about 1.5% of the total value of the Australian Equities. I have taken these dividends off the table and put them to Cash as I was overweight Australian Equities.
Current UK Retail Prices Index: 0.28%
Current Annual Charges: 0.60%
Current Expected Annual Return after Inflation: 4.2%
Current Return Year To Date (from 01 January 2010): 0.1%
How close am I to retirement: 41.3%
The following are the highlights for the month:
- Desired Cash portion moves from 11.6% to 12.4%. This month I have moved further from the desired by going from 12.7% to 13.5%.
- Desired Bonds portion moves from 17.2% to 17.4%. This month I have moved closer to the desired by going from 20.7% to 20.1%.
- Desired Property stays constant at 10.0%. This month I have moved closer to the desired by going from 7.7% to 7.9%. With the poor exchange rates to the GBP I have been reluctant to buy outside the UK and so these purchases have been all UK Commercial Property.
- Desired Commodities stays constant at 5.0%. This month I have moved further from the desired by going from 2.8% to 2.6%. With the poor exchange rates to the GBP I have been reluctant to buy gold. However this asset class is now the furthest from the desired percentage of any asset class. I may buy here soon.
- Desired International Equity portion moves from 13.3% to 12.9%. This month I have moved further from the desired by going from 13.1% to 13.3%.
- Desired Emerging Market Equities stays constant at 5.0%. This month I have stayed constant at 2.9%. In GBP terms Emerging Market Equities are at a near high since May ’08. I have tried to compensate by holding extra UK Equities which earn a reasonable portion of their revenues in International and Emerging Markets.
- Desired Australian Equity portion stays constant at 19.3%. This is because the Reserve Bank of Australia is yet to publish its data yet meaning I am unable to calculate the ASX 200 PE10. This month I have moved closer to the desired by going from 20.9% to 20.5%. It is almost impossible for me to get out of this class tax effectively other than by dividends and by eroding the percentage by not investing in the asset class. Not an ideal situation to be in.
- Desired UK Equity portion moves from 18.6% to 18.0%. This month I have moved further from the desired (partially to compensate for Emerging Markets) by going from 19.2% to 19.3%.
Monday 4 January 2010
2009 Yearly Retirement Investing Portfolio Review
Edited 06 June 2010: I have found more exact data allowing me to determine benchmark returns to the day. I have therefore updated the data in this post to reflect this. As the blog has developed I have also changed the method used to calculate the returns as I have learnt more accurate methods. I started with:
- [assets at end of period – assets at start of period – new money entering portfolio] divided by [assets at start of period],
- then used the mid-point Dietz which was a more accurate method,
- and now use Excel's XIRR function for anual returns. If it is not a full year I then adjust XIRR by the PRR (Personal Rate of Return) = [(1+XIRR Annualised Return)^(# of days/365)]–1.
In those post I also used incorrect weightings for the benchmark portfolio. It should have been 72% stocks/28% bonds as per here.
Apologies for the confusion but I'm learning here too.
----
2008 was a bad year for my investment portfolio and byyear end the 02 January 2009 I was -19.7% -15.7% using [assets at end of period – assets at start of period – new money entering portfolio] divided by [assets at start of period] as my return calculation method. 2009 also started badly and at one point in March my portfolio was -12.4% and we weren’t even a quarter of the way through the year. As everyone knows the markets then started recovering and I rode the wave to end the year at period 02 January 2009 to 31 December 2009 at +21.5% +24.9% including fees.
- [assets at end of period – assets at start of period – new money entering portfolio] divided by [assets at start of period],
- then used the mid-point Dietz which was a more accurate method,
- and now use Excel's XIRR function for anual returns. If it is not a full year I then adjust XIRR by the PRR (Personal Rate of Return) = [(1+XIRR Annualised Return)^(# of days/365)]–1.
In those post I also used incorrect weightings for the benchmark portfolio. It should have been 72% stocks/28% bonds as per here.
Apologies for the confusion but I'm learning here too.
----
2008 was a bad year for my investment portfolio and by
Monday 7 December 2009
Tax Efficient Investments and Tax Wrappers
You would think that governments throughout the world would be trying to encourage people to save for their own retirement and hence remove future burdens from the state. Unfortunately in the United Kingdom I don’t see the current government providing much support or encouragement here. Instead I see a lot of complexity which means unless you know exactly what you are doing you will over your investment life either:
- pay higher taxes than are necessary thereby ending up with a smaller investment pot in the future, or
- pay the same (effectively tax deferral) or lower taxes within tax wrappers but lose a lot or all of this benefit by paying higher fees / charges than needed or even in extreme cases charges on charges with in some instances the added negative of having certain restrictions on what you can and can’t do as defined by the government. Just to give one extreme example, I could even see that if you are only deferring tax within a wrapper but paying higher charges then you are actually worse off than not having a tax wrapper at all and just paying the full tax.
I guess it’s no different to anything else in life. Buyer beware and always carefully do your own research.
Minimising the tax I pay (along with the fees /charges I pay) is one of the cornerstones to my retirement strategy. I can easily show this by thinking of what percentage of my annual returns will come through dividends / interest and the affect that paying high rates of tax will have on my final retirement fund through losing on the compound interest effect. Let me give an example. Average Joe and Mr UK Average have £10,000 in share based investments that provide a dividend yield of 4.5% (average dividend yield of the S&P 500 since 1871 using the Shiller dataset). Both are higher rate 40% tax payers. Now Mr UK Average who doesn’t think about minimising taxation holds these shares outside of any tax efficient wrappers and so pays 32.5% (however in most instances this is really only 25% after tax credits on dividends are calculated). Average Joe holds half of his share based investments in tax wrappers meaning his effective tax rate is only 12.5%. I’m going to ignore capital gains to make the demonstration simple. So where are they after 20 years:
 Average Joe has 11% more assets (and the more years in the calculation the better it gets for average Joe) than Mr UK Average meaning he has the potential for 11% more income in retirement or could hold a less risky investment portfolio for the same lifestyle. Taxes on investments matter.
I use one tax efficient investment type which are National Savings and Investments Index Linked Savings Certificates. Additionally I use 2 tax wrappers which are a Pension which is a Defined Contribution Scheme and a Stocks and Shares Individual Savings Account (Stocks and Shares ISA).
Just a little about each of these as I will cover them in more detail later:
- NS&I Index Linked Savings Certificates today offer a return of the Retail Prices Index (RPI) + 1% however the real benefit, particularly for high rate tax payers is that they are tax free.
- Pensions are extremely complex things and you would think that any government would be trying to simplify them so they could be understood and make them beneficial for all tax payers to save for their future. Unfortunately this doesn’t seem to be happening. I use them as for me personally they provide huge benefits. I can however think of a number of situations where they would provide little to no benefit and in some instances could even make a person worse off. What I am always nervous about however is that with a Pension you lock your money up for a lot of years and with past history as a guide governments will most likely change the rules. I therefore don’t put all my investments here.
- Stocks & Shares ISA’s seem to be no brainer for anyone wanting to invest in the stock markets. They form a pivotal part of my investment strategy. If you look around you can find Stocks and Shares ISA’s that don’t charge you to use the tax wrapper. You still pay to buy the investments inside and these investments might also see charges however this is no different to outside the wrapper. For higher rate tax payers they provide tax benefits from both dividends and capital gains. While for low rate tax payers today, they offer only really capital gains benefits. One thought however is that you never know when you might become a higher tax rate payer or given the disastrous state of the public finances of the UK you never know when as a low rate tax payer you will be taxed on your dividends.
Saturday 5 December 2009
Building My Low Charge Investment Portfolio – Part 3 of 3
Portfolio construction starting point as previously described in Part 2:
22% Bonds (Cash, Index Linked Gilts, Index Linked Savings Certificates)
21% Australian Equities (ASX 300)
21% United Kingdom Equities (FTSE All Share)
15% International Equities (40% US, 40% EU, 20% Japan)
5% Emerging Markets Equities (MSCI Emerging Market TRN Index)
10% Property (Listed Euro Property and UK Commercial)
5% Commodities (Gold)
The final element associated with the construction of my portfolio is an attempt to assess whether the stock market is overvalued or undervalued. I am doing this as the stock market can be a highly volatile / high risk place and if I can take a calculated risk here I might be able to squeeze some more performance out of my portfolio. I will try and be underweight equities when the market appears overvalued and overweight equities when the market appears undervalued. This could be likened to timing the market which history suggests is difficult/impossible meaning I may also end up under performing compared with the traditional buy, hold and rebalance periodically strategy. Only time will tell.
The method I am going to use is that developed by Yale Professor Robert Shiller. He uses a very simple method where he looks at the monthly real (after inflation) market price of the S&P 500 and divides it by the average of the previous 10 years real earnings to get a long term historic real price earnings ratio (Shiller PE10). The real price and Shiller PE10 look to have a relatively high correlation of 0.78. A chart showing both the Shiller PE10 ratio versus the real S&P 500 can be seen below. The December 09 entry is the market close on the 04 December. My current Shiller PE10 estimate will always appear slightly different to Shiller as I use the Standard & Poors website to also enter forecast earnings estimates up to the month of interest. Since 1881 the average Shiller PE10 value has been 16.35.

Another way I have looked at this is to plot a scatter diagram of the Shiller PE10 versus the return made in 12 months time shown below. This I have calculated as the ((Price in 12 months – Price)/Price)+(Dividend in 12 months)/Price). While the R^2 value is quite low a trend line suggests there may be something to be had.

While I will use the average Shiller PE10 value I won’t go silly. I will try to squeeze some performance by on a linear scale will owning 30% less stocks when the Shiller PE10 average is Shiller PE10 Average + 10 = 26.35 and will own 30% more stocks when the Shiller PE10 average is PE10 average -10 = 6.35. I will use this methodology as a proxy for all my International Equities and United Kingdom Equities as Hale suggests a high correlation between UK Equities and International Equities and I have struggled to find good historic data for UK, European and Japanese equities. Today’s Shiller PE10 is 20.2 meaning that instead of holding 21% UK Equities today my target is 18.6%. Similarly instead of 15% International Equities today my target is 13.3%.
For my Australian Equities I have been able to find some Inflation and ASX 200 data from the Reserve Bank of Australia. Unfortunately all the data needed only starts from 1982 which is not a long time ago. Even so I have calculated and show what I will call the ASX 200 PE10 chart versus the Real ASX 200 below. I have estimated average ASX 200 PE10 to November 2009 to be 18.5. The correlation between the Real ASX 200 and the ASX 200 PE10 appears high at 0.82. For my Australian Equities I will use a nominal ASX 200 PE10 value of 16 to equate to when I hold 21% Australian Equities. Otherwise I will use the same assumptions as for the UK and International Equities. Therefore with an ASX 200 PE10 of 18.5 today my target is 19.3%.

When I am underweight I intend to hold the extra in bonds/cash. For my emerging markets equities because it is a small amount I will not vary the weighting but always target 5%.
So that’s how I’ve arrived at my target asset allocations. Today this means a Desired low Charge Portfolio of:
28.8% Bonds (Cash, Index Linked Gilts, Index Linked Savings Certificates)
19.3% Australian Equities (ASX 300)
18.6% United Kingdom Equities (FTSE All Share)
13.3% International Equities (40% US, 40% EU, 20% Japan)
5% Emerging Markets Equities (MSCI Emerging Market TRN Index)
10% Property (Listed Euro Property and UK Commercial)
5% Commodities (Gold)
Friday 4 December 2009
My Current Low Charge Portfolio – December 2009
 Another month passes.
Buying: Property, Index Linked Gilts, UK Equities, International Equity
Selling: Nothing this month
Dividends: Nothing this month
Current UK Retail Prices Index: -0.78%
Current Annual Charges: 0.60%
Current Expected Annual Return after Inflation: 4.26%
Current Return Year To Date: 22.9%
How close am I to retirement: 40.8%
Building My Low Charge Investment Portfolio – Part 2 of 3
Portfolio construction starting point as previously described in Part 1
28% Bonds
72% Equities
Continuing to learn from Hale and Bernstein I then chose to add Property as a portfolio diversifier as it can be uncorrelated to Equities and Bonds. The more uncorrelated the assets theoretically the more likelihood that some assets will be low in price (and hence required to be bought by the author) while other assets are high in price (and hence required to be sold). To give 2 examples, Bernstein presents data from 1973 to 1998 suggesting a Property – (REIT - National Association of Real Estate Investment Trusts) to US Equities correlation of 0.56 while Hale presents data suggesting a UK Property to UK Equities correlation of 0.3. The property types I have chosen to buy into are predominantly Listed European Property Securities excluding the United Kingdom and a fund buying United Kingdom commercial property. I chose to allocate 10% to this sector. Portfolio is now:
23% Bonds
67% Equities
10% Property (Listed Euro Property and UK Commercial)
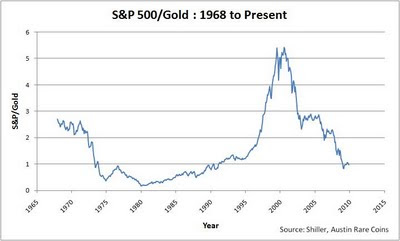
Next I chose to add some commodities exposure. Initially I went for exposure via a low cost ETC that gave exposure to energy, precious metals, industrial metals, livestock and agriculture via Futures contracts. In hindsight I think that what I did was a mistake and the reason you should always do your own research as I lost quite a lot of money here. Before anybody buys direct exposure to commodities I suggest you read about Contango / Backwardation , Counter-party risk. Additionally many ETC / ETF’s allow you to leverage your returns. Be sure to understand the affects of this also as they are typically rebalanced daily meaning performance will differ from what you expect. So what did I buy? In the end I settled on a simple vanilla ETF that buys physical gold and so tracks the gold spot price minus fees. Why gold? Using the Shiller dataset for the S&P 500 and the Austin Rare Coins dataset for Gold for the years 1968 to present day a relatively low correlation of 0.5 is achieved. What does 0.5 look like? Well rather than just show actual prices in history I present a chart showing real prices (ie after inflation) for both assets.
 Additionally, it’s also worth looking at a chart showing the ratio of the S&P 500 to Gold (excluding inflation).
As always make up your own mind but I’ve settled for 5% to be allocated to Gold. As commodities can be highly volatile I’ve taken my Gold allocation from equities. Portfolio is now:
23% Bonds
62% Equities
10% Property (Listed Euro Property and UK Commercial)
5% Commodities (Gold)
Now to how I’ve allocated my equities. Hale suggests that traditional developed world equities have very high correlations of about 0.9 and so do not significantly diversify the portfolio. I guess this is because of globalisation. Emerging Markets on the other hand seem to have a much lower correlation of around 0.7. I’ve still chosen to spread widely through the world to remove country risk as much as possible and also to pick up some swings from exchange rates. I’ve settled on 21% Australian Equities, 21% UK Equities, 15% International Equities and 5% Emerging Market Equities. My Australian Equities are generally ASX 300 low cost trackers. My UK Equities are generally FTSE All Share low cost trackers. My International Equities are targeted to be 40% US, 40% Europe and 20% Japan. My 5% Emerging Markets simply track the MSCI Emerging Market TRN Index. Portfolio is now:
22% Bonds
21% Australian Equities (ASX 300)
21% United Kingdom Equities (FTSE All Share)
15% International Equities (40% US, 40% EU, 20% Japan)
5% Emerging Markets Equities (MSCI Emerging Market TRN Index)
10% Property (Listed Euro Property and UK Commercial)
5% Commodities (Gold)
Finally to my bond allocation. Within my bond allocation the first thing I do is hold 6 months worth of salary in cash. Just in case... Next within low tax wrappers I’m holding predominantly holding Index linked Gilts as I’m always concerned about returns after inflation. The final variation from a traditional bond allocation is that outside of the tax wrappers where instead of bonds I am holding what I consider to be a great little product from National Savings and Investments which are Index linked Savings Certificates. Portfolio is now:
22% Bonds (Cash, Index Linked Gilts, Index Linked Savings Certificates)
21% Australian Equities (ASX 300)
21% United Kingdom Equities (FTSE All Share)
15% International Equities (40% US, 40% EU, 20% Japan)
5% Emerging Markets Equities (MSCI Emerging Market TRN Index)
10% Property (Listed Euro Property and UK Commercial)
5% Commodities (Gold)
So that’s my portfolio based on what I think are basically traditional asset allocation strategies. The final portfolio weightings however are where I try and introduce allocations that vary based on what I think is a sensible method for determining asset values at any point in time. This I’ll cover in Part 3.
28% Bonds
72% Equities
Continuing to learn from Hale and Bernstein I then chose to add Property as a portfolio diversifier as it can be uncorrelated to Equities and Bonds. The more uncorrelated the assets theoretically the more likelihood that some assets will be low in price (and hence required to be bought by the author) while other assets are high in price (and hence required to be sold). To give 2 examples, Bernstein presents data from 1973 to 1998 suggesting a Property – (REIT - National Association of Real Estate Investment Trusts) to US Equities correlation of 0.56 while Hale presents data suggesting a UK Property to UK Equities correlation of 0.3. The property types I have chosen to buy into are predominantly Listed European Property Securities excluding the United Kingdom and a fund buying United Kingdom commercial property. I chose to allocate 10% to this sector. Portfolio is now:
23% Bonds
67% Equities
10% Property (Listed Euro Property and UK Commercial)
Next I chose to add some commodities exposure. Initially I went for exposure via a low cost ETC that gave exposure to energy, precious metals, industrial metals, livestock and agriculture via Futures contracts. In hindsight I think that what I did was a mistake and the reason you should always do your own research as I lost quite a lot of money here. Before anybody buys direct exposure to commodities I suggest you read about Contango / Backwardation , Counter-party risk. Additionally many ETC / ETF’s allow you to leverage your returns. Be sure to understand the affects of this also as they are typically rebalanced daily meaning performance will differ from what you expect. So what did I buy? In the end I settled on a simple vanilla ETF that buys physical gold and so tracks the gold spot price minus fees. Why gold? Using the Shiller dataset for the S&P 500 and the Austin Rare Coins dataset for Gold for the years 1968 to present day a relatively low correlation of 0.5 is achieved. What does 0.5 look like? Well rather than just show actual prices in history I present a chart showing real prices (ie after inflation) for both assets.
 Additionally, it’s also worth looking at a chart showing the ratio of the S&P 500 to Gold (excluding inflation).
As always make up your own mind but I’ve settled for 5% to be allocated to Gold. As commodities can be highly volatile I’ve taken my Gold allocation from equities. Portfolio is now:
23% Bonds
62% Equities
10% Property (Listed Euro Property and UK Commercial)
5% Commodities (Gold)
Now to how I’ve allocated my equities. Hale suggests that traditional developed world equities have very high correlations of about 0.9 and so do not significantly diversify the portfolio. I guess this is because of globalisation. Emerging Markets on the other hand seem to have a much lower correlation of around 0.7. I’ve still chosen to spread widely through the world to remove country risk as much as possible and also to pick up some swings from exchange rates. I’ve settled on 21% Australian Equities, 21% UK Equities, 15% International Equities and 5% Emerging Market Equities. My Australian Equities are generally ASX 300 low cost trackers. My UK Equities are generally FTSE All Share low cost trackers. My International Equities are targeted to be 40% US, 40% Europe and 20% Japan. My 5% Emerging Markets simply track the MSCI Emerging Market TRN Index. Portfolio is now:
22% Bonds
21% Australian Equities (ASX 300)
21% United Kingdom Equities (FTSE All Share)
15% International Equities (40% US, 40% EU, 20% Japan)
5% Emerging Markets Equities (MSCI Emerging Market TRN Index)
10% Property (Listed Euro Property and UK Commercial)
5% Commodities (Gold)
Finally to my bond allocation. Within my bond allocation the first thing I do is hold 6 months worth of salary in cash. Just in case... Next within low tax wrappers I’m holding predominantly holding Index linked Gilts as I’m always concerned about returns after inflation. The final variation from a traditional bond allocation is that outside of the tax wrappers where instead of bonds I am holding what I consider to be a great little product from National Savings and Investments which are Index linked Savings Certificates. Portfolio is now:
22% Bonds (Cash, Index Linked Gilts, Index Linked Savings Certificates)
21% Australian Equities (ASX 300)
21% United Kingdom Equities (FTSE All Share)
15% International Equities (40% US, 40% EU, 20% Japan)
5% Emerging Markets Equities (MSCI Emerging Market TRN Index)
10% Property (Listed Euro Property and UK Commercial)
5% Commodities (Gold)
So that’s my portfolio based on what I think are basically traditional asset allocation strategies. The final portfolio weightings however are where I try and introduce allocations that vary based on what I think is a sensible method for determining asset values at any point in time. This I’ll cover in Part 3.
Tuesday 1 December 2009
Building My Low Charge Investment Portfolio – Part 1 of 3
Note added 11 January 2009. My calculations below generally use arithmetic means. It may be more appropriate to use compound annual growth rates. See here.
Before I start let me emphasise that my strategy is a long term one. I am not a share trader. In fact, I tried it very briefly and was hopeless. For me the duration of my investment strategy is the rest of my life as I’m using it for retirement planning. Retirement in my definition is that work becomes optional and so I’m trying to get there as quickly as possible. However I guess it might also work for other long term goals – university fees for a newly born child, planning to give a newly born child a head start on their 18th birthday etc.
Now the first thing I did was some reading. I would like to recommend two very good books – “Smarter Investing : Simpler Decisions for Better Results” by Tim Hale and “The Intelligent Asset Allocator” by William Bernstein. If you are UK based I’d start with Hale and if US based then Bernstein. I can’t highlight enough how beneficial these books were in my retirement strategy.
The first two building blocks I chose were equities and bonds.
What returns can I expect from equities and bonds? Firstly I will always try and talk in after inflation terms (I’ll typically use the word Real) as we all want to maintain our standard of leaving. Please don’t underestimate the damage of inflation to your wealth. To demonstrate how damaging inflation is I will use a very good data set that is available from Yale Professor Robert Shiller’s website1 that lists US CPI data. This demonstrates that to have the equivalent of $12.46 in 1871 today would require you to have in your hand $216.24. This has made me always consider inflation in everything I do.
So to equity returns. Hale suggests that for the UK from the period 1900 to 2004 real (ie after inflation) average equity returns were 7.3%. Bernstein suggests that for US 1926 to 1998 equity returns averaged 11.22% however again using the Shiller1 data set as a basis suggests average inflation over that period was 3.2% so a real return of 8%. Using the Shiller dataset from 1871 to present day for US equities suggests that the real average capital gain was 3.5% and the real average dividend was 4.5% for an average real return of 8%. So as close as I need it to be for what I am doing.
Now to bond returns. Hale suggests that for the UK from the period 1900 to 2004 real average bond returns were 2.3%. Bernstein suggests that for US 1926 to 1998 5 year treasury returns averaged 5.31% for a real return of 2.11%. Again as close as I need it to be.
Finally combining equity and bonds as my basic building blocks and having assessed my attitude to risk I came to a 72% equity and 28% bond weighting. In multiple locations I have heard a ‘rule of thumb’ that you should own 100 minus your age in equities. I’m more aggressive than that at this stage of my life.
In projecting retirement dates I’m assuming real average equity returns of 7.3% and for the majority of my “bonds” real average returns of 1%. The 1% I’ll explain in the future when I look at some strategies I’m using to minimise the tax I pay. Assuming I stayed at this allocation and achieved averages I could assume an instantaneous real average return of 72% x 7.3% + 28% x 1% = 5.5% - 0.6% (my current average fees) = 4.9% per annum before taxation. Now clearly I won’t get this consistently as I’ll reduce equity weightings as I get older and nothing works in averages but it demonstrates an order of magnitude. Worst case we have a big crash in equities and/or bonds and I get a return much worse than this. Hale shows the effects and risks of this quite nicely.
Now by rebalancing regularly to take advantage of the fact that over the long term equities and bonds are not perfectly correlated I’ll end up buying whatever is lowest in value and selling whatever is highest to hopefully give a little more of a kick.
I could have probably left it at that and hopefully lived happily ever after however as I’ll show as I blog I’ve gone a lot further than that.
To be continued in Part 2 here
Sunday 29 November 2009
My Current Low Charge Portfolio – November 2009

As this is the first My Current Low Charge Portfolio let me explain what I will be presenting monthly. I will present 2 charts. The first is My Current Low Charge Portfolio and the second is a Desired Low Charge Portfolio. The Desired is calculated using a number of criteria which will be explained over time but it will vary when Equity Market prices or earnings increase or decrease in price. Additionally it will change as I age.
Over time I will explain each of my asset classes in more detail.
Current UK Retail Prices Index: -0.78%
Current Annual Charges: 0.59%
Current Expected Annual Return after Inflation: 4.24%
Current Annual Charges: 0.59%
Current Expected Annual Return after Inflation: 4.24%
Current Return Year To Date: 21.5%
How close am I to retirement: 39.7%
First Post – The 5 W’s
As this is the first post I thought I would give a little introduction as to what motivated me to start this blog looking at my own personal Retirement Investing. This is best done using the 5 W’s.
Who:
As my profile suggests I am a mid 30’s average Joe who became disillusioned with the Financial Sector in 2007.
What:
My investment strategy is really simple. The principles are:
- invest across a number of different asset classes
- buy whatever asset class has been performing the worst
- reduce exposure to whatever asset class has been performing the best
- minimise the fees that I pay
- minimise the taxes I pay by using tax wrappers where possible
- never invest in anything I don’t understand (so no CDO’s or MBS’s)
When:
I will try and write regularly however this is not my day job which keeps me extremely busy. I will attempt to cover four main topics regularly:
- my current Portfolio including expected average return after inflation and the current average fees
- a more detailed description of what I am investing in and my methodology for Portfolio Allocation
- describe whenever I make a buy or sell decision
- anything I am currently finding interesting in the financial markets
Where:
I currently live in the United Kingdom and so I will in due course use words like Pension’s and ISA’s as the blog develops. My investments will however be in many countries throughout the world so people from all countries should hopefully find it interesting.
Why:
I was looking for a Financial Planner in 2007 and whenever I made my first contact I came across a massive behemoth of a building in a prime location that must have cost millions, a lovely foyer and people in very smart suits. I am sure these guys/girls add real value and help many people achieve their goals. However for some reason I could only think that it would be me paying for all of this.
At about the same time I came across a book title called “Where are the Customer Yachts” by Fred Schwed. This had me thinking even more.
When I started looking at possible investment opportunities the fees and charges just leapt out at me. To demonstrate this have a look at the table below which demonstrates how fees and charges can affect your portfolio over time. I have assumed that inflation is 2% and the return including inflation is 6%. The fund on the left I have called My Low Charge Portfolio. I never buy any investments that have an initial charge and I am always looking to choose the best investment for the least annual charge in this case 0.59%. I chose this figure as it is my current annual charge on my total portfolio. The fund on the right is fictitious but is not unlike some Balanced Funds you can buy. It has initial charges of 4% and an annual charge of 1.5%. Over a 20 year investment period the difference is astronomical. My Low Charge Portfolio is 24% large than the Balanced Portfolio. This has been achieved doing nothing more than minimising charges.

Subscribe to:
Posts (Atom)