Showing posts with label FTSE100. Show all posts

Thursday 12 July 2012

The FTSE 100 Cyclically Adjusted PE Ratio (FTSE 100 CAPE or PE10) – July 2012 Update

This is the Retirement Investing Today monthly update for the FTSE 100 Cyclically Adjusted PE (FTSE 100 CAPE).  Last month’s update can be found here.

Before we look at the CAPE let us first look at other key FTSE 100 metrics:
-    The FTSE 100 Price is currently 5,608 which is a large 6.6% above the 01 June 2012 Price of 5,260.
-    The FTSE 100 Dividend Yield is currently 3.78% having fallen back from 4.00% on the 01 June 2012.
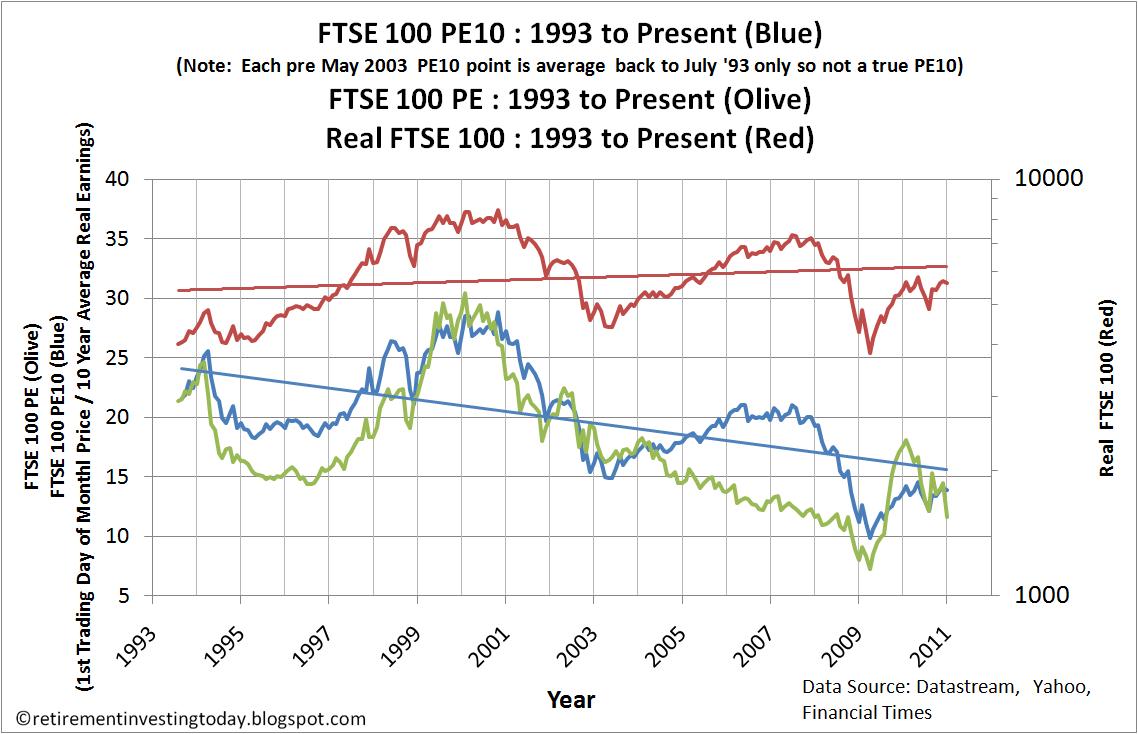
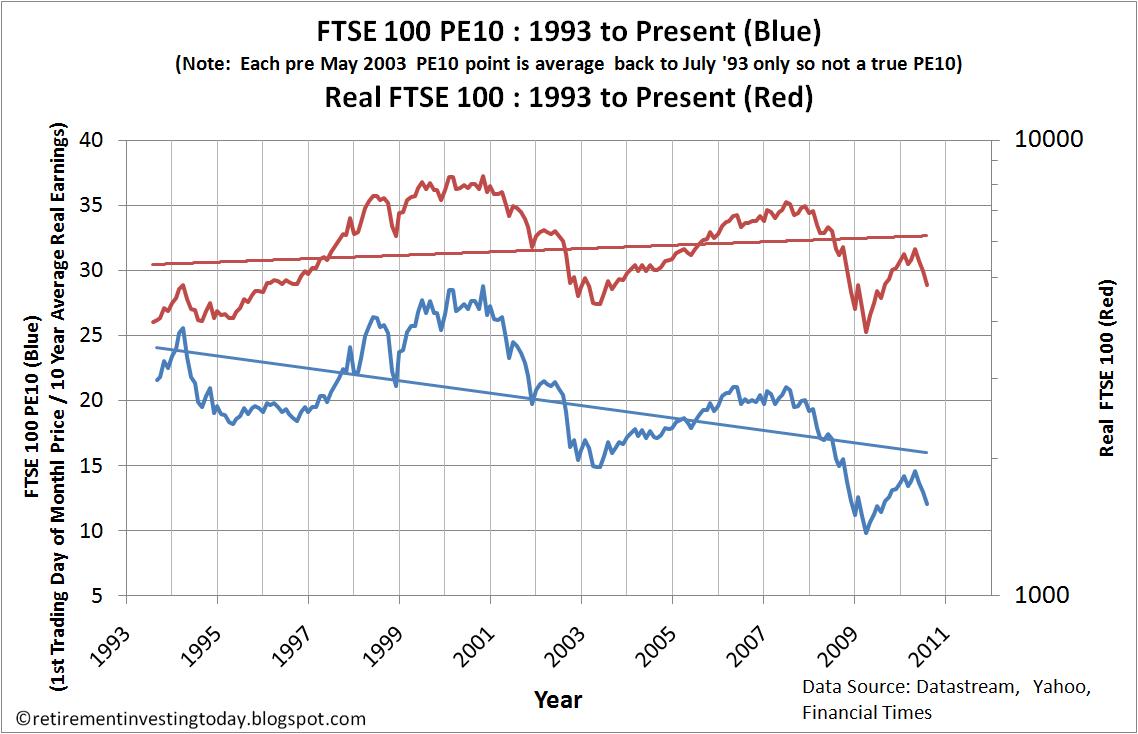
-    The FTSE 100 Price to Earnings (P/E) Ratio is currently 10.08 which is up 7.7% since the 01 June 2012.
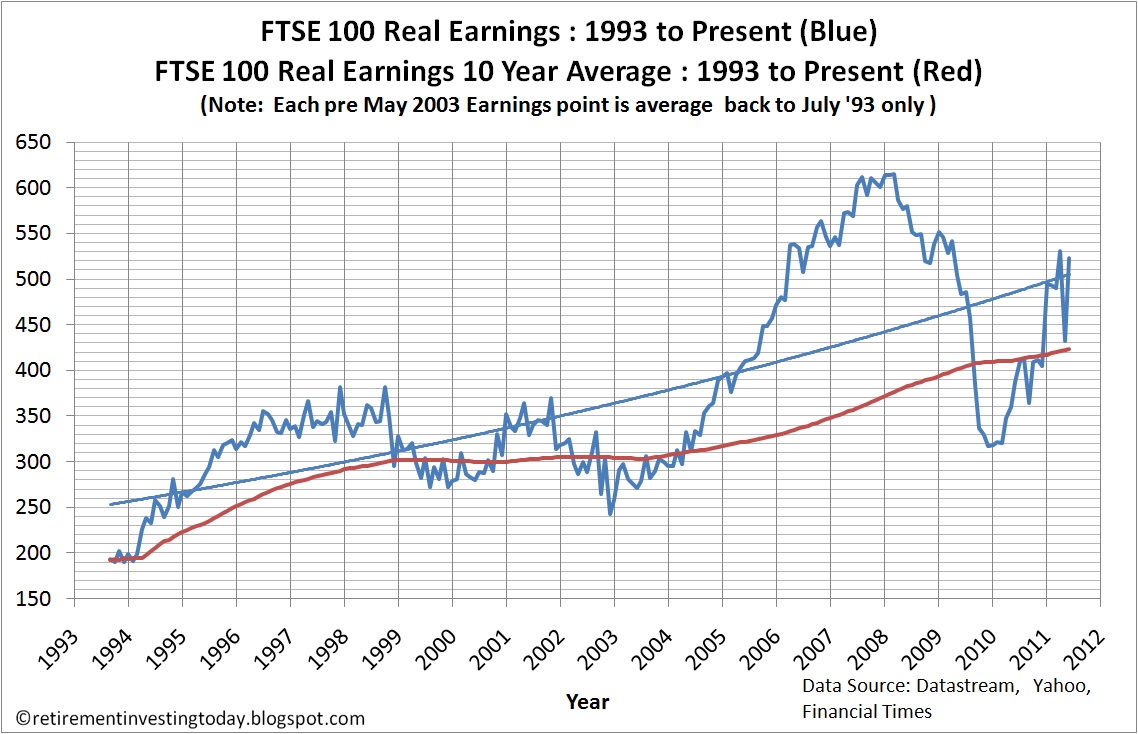
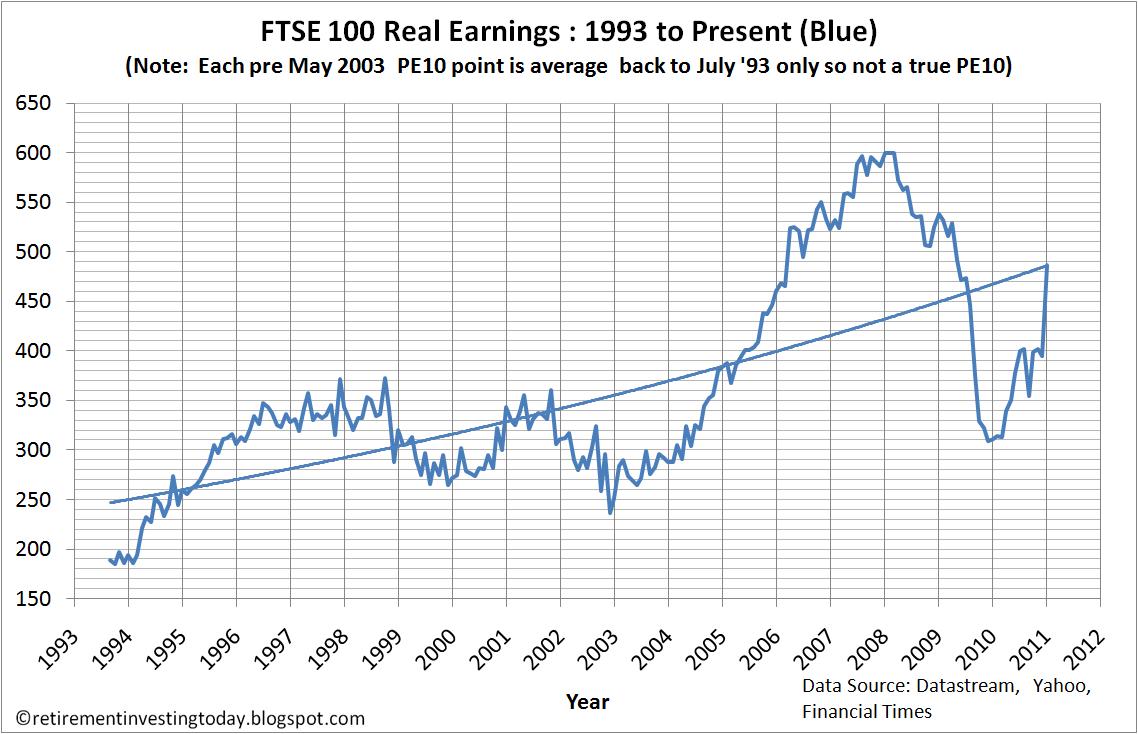
-    The Price and the P/E Ratio allows us to calculate the FTSE 100 As Reported Earnings (which are the last reported year’s earnings and are made up of the sum of the latest two half years earnings) as 556.

Tuesday 5 June 2012

The FTSE 100 Cyclically Adjusted PE Ratio (FTSE 100 CAPE or PE10) – June 2012 Update

It’s been a year almost to the day since I last posted data on the FTSE 100 Cyclically Adjusted PE ratio.  It’s therefore worth taking a little more time on this post to spell out how exactly I’m calculating this metric.  To my knowledge I am the only person on the internet who is freely making this data available however I have had to make some assumptions to build this dataset.

As I write this post the UK stock market is closed.  The last trading day was Friday 01 June 2012 at which point the FTSE 100 closed at 5,260.  At this price the FTSE Actuaries Share Indices provides us with a FTSE 100 P/E Ratio of 9.4 which allows us to calculate Earnings as 562.  These Earnings are as Reported Earnings, which are the last reported year’s earnings and are made up of the sum of the latest two half years earnings.  This will differ from a lot of calculated earnings presented online, which will be on an ‘as earned’ (which is the current forecast earnings) basis, resulting in differences, particularly when there are large upward or downward adjustments in earnings.

As of Friday the dividend yield has crept up to 4%.  The last time we were over 4% was July 2009.

Tuesday 21 June 2011

The FTSE 100 cyclically adjusted PE ratio (FTSE 100 CAPE or PE10) – June 2011


While we all sit back and watch the train wreck that is Greece prepare to default (or whatever posh name they will come up with in due course) the UK goes on happily borrowing money at the rate of £17.4 billion for the month.  That’s £17,400,000,000 in a month.  What’s concerning me is that servicing our debt now takes 8.5% of government spending.  That’s more than the complete tax take from corporation tax (page 6 here).  All I can say is that the future generations will not be pleased.  I’m just a simple Average Joe but it really just doesn’t seem right asking children who are not yet born to pay for our lifestyle today.    
As this all unfolds we’ve seen stock markets around the world decrease in price in recent times.  I actually have no idea what moves prices (that’s why I don’t trade) but I can’t help feel that Greece is having a good impact but also we shouldn’t forget good news like this from China.

Tuesday 10 May 2011

The FTSE 100 cyclically adjusted PE ratio (FTSE 100 CAPE or PE10) – May 2011

Now that I’m back in the blogging world I’ve been catching up on all the great posts that I’ve missed over the past few months from My Blog List (full list in the right hand sidebar of the page).  Great UK based blogs such as Monevator, A Grain of Salt, Simple Living in Suffolk and UK Value InvestorThis post from ermine at Simple Living has however made me think about my cyclically adjusted PE (PE10 or CAPE) strategy and whether it is the right thing to be doing.  I am a big believer in the Keep It Simple Stupid (KISS) principle and if somebody like ermine can’t understand what I’m up to then have I made it all too complicated?

Sunday 12 December 2010

The FTSE 100 cyclically adjusted PE ratio (CAPE or PE10) – December 2010

Today’s first chart shows that with the nominal FTSE 100 price moving from 5694.6 (01 November) to 5642.5 (01 December) over the month, a decrease of 0.9%, the cyclically adjusted PE ratio (PE10 or CAPE) has also fallen from 14.1 to 13.9. These calculations are based on using the Consumer Price Index (CPI) to correct for inflationary effects. If I was to use the Retail Prices Index the PE10 would be 13.6. This is still well below the FTSE 100 PE10 20 Percentile for this dataset of 16.8 while the 80 Percentile is 23.7. The long run average is 19.9 for the dataset shown in the chart. The correlation between the PE10 and the Real (inflation adjusted by the CPI) FTSE Price remains a strong 0.69. In comparison the standard PE ratio is sitting at 11.6, down from 14.5 last month.

Sunday 3 October 2010

No nonsense FTSE 100 cyclically adjusted PE ratio update – October 2010

No ramblings from me today. It’s just a simple update of the FTSE 100 cyclically adjusted PE (CAPE or PE10).

The first chart shows that with the nominal FTSE 100 price moving from 5371 to 5592.9, an increase of 4.1%, over the month the PE10 ratio has also risen from 13.5 to 14.1. This is still well below the FTSE 100 PE10 20 Percentile of 17.0 while the 80 Percentile is 23.7. The long run average is now 19.9 for the dataset shown in the chart. The correlation between the PE10 and the Real (inflation adjusted by the CPI) FTSE Price is a strong 0.70.

Wednesday 4 August 2010

My first FTSE 100 cyclically adjusted PE ratio update – August 2010

As regular readers will know I monthly follow the cyclically adjusted PE ratios, also known as a CAPE or PE10, for both the US S&P 500 and the Australian ASX 200. Based on this information I make tactical asset allocations to my equity funds with the only exception being my allocation to emerging markets. Today though is quite exciting because it’s the first update of a brand new dataset which I first introduced here. That dataset is the FTSE 100 CAPE or FTSE 100 PE10 and it is the ratio of the Real (inflation adjusted) Price divided by the average Real Earnings of the last 10 years for the FTSE 100.

Sunday 11 July 2010

UK FTSE 100 CAPE or FTSE PE10 based on the Shiller cyclically adjusted price earnings ratio model

Update 13 July 2010: Chart 3 added following UKVI's comment below.

For many months now I have been showing the PE10 for the ASX200 and the S&P500 however what I have always been looking for is a cyclically adjusted PE ratio dataset for the UK FTSE100. In shorthand a FTSE100 CAPE or FTSE100 PE10 depending on your preference for acronyms. Unfortunately a complete dataset has been impossible to find. I have therefore spent many hours constructing one from pieces of data taken from Motley Fool Discussion Boards, the Financial Times marketdata and Yahoo Finance. I therefore can for the first time present a chart of the FTSE100 PE10 and for good measure I’ll throw in the Real (inflation adjusted) FTSE100.